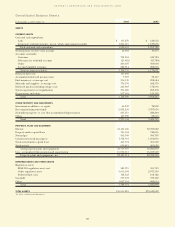
Entergy 2008 Annual Report Download - page 66
Download and view the complete annual report
Please find page 66 of the 2008 Entergy annual report below. You can navigate through the pages in the report by either clicking on the pages listed below, or by using the keyword search tool below to find specific information within the annual report.-
 1
1 -
2
-
3
-
4
-
5
-
6
-
7
-
8
-
9
-
10
-
11
-
12
-
13
-
14
-
15
-
16
-
17
-
18
-
19
-
20
-
21
-
22
-
23
-
24
-
25
-
26
-
27
-
28
-
29
-
30
-
31
-
32
-
33
-
34
-
35
-
36
-
37
-
38
-
39
-
40
-
41
-
42
-
43
-
44
-
45
-
46
-
47
-
48
-
49
-
50
-
51
-
52
-
53
-
54
-
55
-
 56
56 -
 57
57 -
 58
58 -
 59
59 -
 60
60 -
 61
61 -
 62
62 -
 63
63 -
 64
64 -
 65
65 -
 66
66 -
 67
67 -
 68
68 -
 69
69 -
 70
70 -
 71
71 -
 72
72 -
 73
73 -
 74
74 -
 75
75 -
 76
76 -
77
-
78
-
79
-
80
-
81
-
82
-
83
-
84
-
85
-
86
-
87
-
88
-
89
-
90
-
91
-
92
-
93
-
94
-
95
-
96
-
97
-
98
-
99
-
100
-
101
-
102
-
103
-
104
-
105
-
106
-
107
-
108
 |
 |

6464
ENTERGY CORPORATION AND SUBSIDIARIES 2008
64
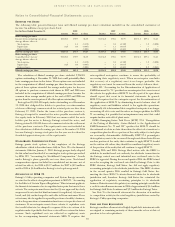
Notes to Consolidated Financial Statements continued
The calculation of diluted earnings per share excluded 3,326,835
options outstanding at December 31, 2008 that could potentially dilute
basic earnings per share in the future. Those options were not included
in the computation of diluted earnings per share because the exercise
price of those options exceeded the average market price for the year.
All options to purchase common stock shares in 2007 and 2006 were
included in the computation of diluted earnings per share because the
common share average market price at the end of 2007 and 2006 was
greater than the exercise prices of all of the options outstanding.
Entergy had 10,000,000 equity units outstanding as of December
31, 2008 that obligated the holders to purchase a certain number
of shares of Entergy common stock for a stated price no later than
February 17, 2009. Under the terms of the purchase contracts,
Entergy attempted to remarket the notes payable associated with
the equity units in February 2009 but was unsuccessful, the note
holders put the notes to Entergy, Entergy retired the notes, and
Entergy issued 6,598,000 shares of common stock in the settlement
of the purchase contracts. The equity units were not included in
the calculation of diluted earnings per share at December 31, 2006
because Entergy’s average stock price for the year was less than the
threshold appreciation price of the equity units.
ST O C K -BA S E D CO M P E N S AT I O N PL A N S
Entergy grants stock options to key employees of the Entergy
subsidiaries, which is described more fully in Note 12 to the financial
statements. Effective January 1, 2003, Entergy prospectively adopted
the fair value based method of accounting for stock options prescribed
by SFAS 123, “Accounting for Stock-Based Compensation.” Awards
under Entergy’s plans generally vest over three years. Stock-based
compensation expense included in consolidated net income, net of
related tax effects, for 2008 is $10.7 million, for 2007 is $8.9 million,
and for 2006 is $6.8 million for Entergy’s stock options granted.
AP P L I C A T I O N O F SFAS 71
Entergy’s Utility operating companies and System Energy currently
account for the effects of regulation pursuant to SFAS 71, “Accounting
for the Effects of Certain Types of Regulation.” This statement applies to
the financial statements of a rate-regulated enterprise that meets three
criteria. The enterprise must have rates that (i) are approved by a body
empowered to set rates that bind customers (its regulator); (ii) are cost-
based; and (iii) can be charged to and collected from customers. These
criteria may also be applied to separable portions of a utility’s business,
such as the generation or transmission functions, or to specific classes of
customers. If an enterprise meets these criteria, it capitalizes costs
that would otherwise be charged to expense if the rate actions of its
regulator make it probable that those costs will be recovered in future
revenue. Such capitalized costs are reflected as regulatory assets
in the accompanying financial statements. SFAS 71 requires that
rate-regulated enterprises continue to assess the probability of
recovering their regulatory assets. When an enterprise concludes
that recovery of a regulatory asset is no longer probable, the
regulatory asset must be removed from the entity’s balance sheet.
SFAS 101, “Accounting for the Discontinuation of Application of
FASB Statement No. 71,” specifies how an enterprise that ceases to meet
the criteria for application of SFAS 71 for all or part of its operations
should report that event in its financial statements. In general,
SFAS 101 requires that the enterprise report the discontinuation of
the application of SFAS 71 by eliminating from its balance sheet all
regulatory assets and liabilities related to the applicable operations.
Additionally, if it is determined that a regulated enterprise is no longer
recovering all of its costs and therefore no longer qualifies for SFAS
71 accounting, it is possible that an impairment may exist that could
require further write-offs of plant assets.
FASB’s Emerging Issues Task Force (EITF) 97-4: “Deregulation
of the Pricing of Electricity - Issues Related to the Application of
FASB Statements No. 71 and 101” specifies that SFAS 71 should be
discontinued at a date no later than when the effects of a transition to
competition plan for all or a portion of the entity subject to such plan
are reasonably determinable. Additionally, EITF 97-4 promulgates
that regulatory assets to be recovered through cash flows derived from
another portion of the entity that continues to apply SFAS 71 should
not be written off; rather, they should be considered regulatory assets
of the portion of the entity that will continue to apply SFAS 71.
During 2005 and 2006, Entergy filed notices with the FERC to
withdraw its market-based rate authority for wholesale transactions in
the Entergy control area and submitted new cost-based rates to the
FERC for approval. During the second quarter 2006, the FERC issued
an order accepting the cost-based rates filed by Entergy. Prior to this
FERC decision, Entergy Gulf States, Inc. did not apply regulatory
accounting principles to its wholesale jurisdiction. The FERC decision
in the second quarter 2006 resulted in Entergy Gulf States, Inc.
meeting the three SFAS 71 criteria discussed above for its wholesale
jurisdiction and, therefore, Entergy Gulf States, Inc. reinstated the
application of regulatory accounting principles to its wholesale
business. Reinstatement of regulatory accounting principles resulted in
a credit to miscellaneous income in 2006 of approximately $4.5 million
for Entergy Gulf States Louisiana and $3.3 million for Entergy Texas.
See Note 2 to the financial statements for discussion of transition
to competition activity in the retail regulatory jurisdictions served by
Entergy’s Utility operating companies.
CA S H A N D CA S H EQ U I V A L E N T S
Entergy considers all unrestricted highly liquid debt instruments with
an original or remaining maturity of three months or less at date of
purchase to be cash equivalents.
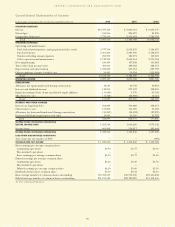
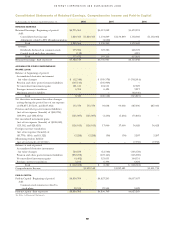
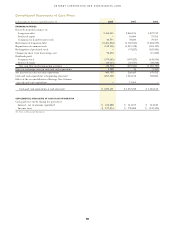
EA R N I N G S P E R SH A R E
The following table presents Entergy’s basic and diluted earnings per share calculation included on the consolidated statements of
income (in millions, except per share data):
For the Years Ended December 31, 2008 2007 2006
Income Shares $/share Income Shares $/share Income Share $/share
Basic earnings per share
Income from continuing operations $1,220.6 190.9 $6.39 $1,134.8 196.6 $5.77 $1,133.1 207.5 $5.46
Average dilutive effect of:
Stock options – 4.1 (0.132) – 5.0 (0.142) – 3.8 (0.098)
Equity units 24.7 6.0 (0.065) – 1.1 (0.033) – – –
Deferred units – (0.001) – 0.1 (0.003) – 0.2 (0.005)
Diluted earnings per share $1,245.3 201.0 $6.20 $1,134.8 202.8 $5.60 $1,133.1 211.5 $5.36
Basic earnings per share
Consolidated net income $1,220.6 190.9 $6.39 $1,134.8 196.6 $5.77 $1,132.6 207.5 $5.46
Average dilutive effect of:
Stock options – 4.1 (0.132) – 5.0 (0.142) – 3.8 (0.098)
Equity units 24.7 6.0 (0.065) – 1.1 (0.033) – – –
Deferred units – (0.001) – 0.1 (0.003) – 0.2 (0.005)
Diluted earnings per share $1,245.3 201.0 $6.20 $1,134.8 202.8 $5.60 $1,132.6 211.5 $5.36