Entergy 2008 Annual Report Download - page 60
Download and view the complete annual report
Please find page 60 of the 2008 Entergy annual report below. You can navigate through the pages in the report by either clicking on the pages listed below, or by using the keyword search tool below to find specific information within the annual report.-
 1
1 -
2
-
3
-
4
-
5
-
6
-
7
-
8
-
9
-
10
-
11
-
12
-
13
-
14
-
15
-
16
-
17
-
18
-
19
-
20
-
21
-
22
-
23
-
24
-
25
-
26
-
27
-
28
-
29
-
30
-
31
-
32
-
33
-
34
-
35
-
36
-
37
-
38
-
39
-
40
-
41
-
42
-
43
-
44
-
45
-
46
-
47
-
48
-
49
-
 50
50 -
 51
51 -
 52
52 -
 53
53 -
 54
54 -
 55
55 -
 56
56 -
 57
57 -
 58
58 -
 59
59 -
 60
60 -
 61
61 -
 62
62 -
 63
63 -
 64
64 -
 65
65 -
 66
66 -
 67
67 -
 68
68 -
 69
69 -
 70
70 -
71
-
72
-
73
-
74
-
75
-
76
-
77
-
78
-
79
-
80
-
81
-
82
-
83
-
84
-
85
-
86
-
87
-
88
-
89
-
90
-
91
-
92
-
93
-
94
-
95
-
96
-
97
-
98
-
99
-
100
-
101
-
102
-
103
-
104
-
105
-
106
-
107
-
108
 |
 |

5858
ENTERGY CORPORATION AND SUBSIDIARIES 2008
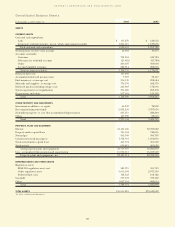
Consolidated Balance Sheets
In thousands, as of December 31, 2008 2007
ASSETS
CURRENT ASSETS
Cash and cash equivalents:
Cash $ 115,876 $ 126,652
Temporary cash investments - at cost, which approximates market 1,804,615 1,127,076
Total cash and cash equivalents 1,920,491 1,253,728
Securitization recovery trust account 12,062 19,273
Accounts receivable:
Customer 734,204 610,724
Allowance for doubtful accounts (25,610) (25,789)
Other 206,627 303,060
Accrued unbilled revenues 282,914 288,076
Total accounts receivable 1,198,135 1,176,071
Deferred fuel costs 167,092 –
Accumulated deferred income taxes 7,307 38,117
Fuel inventory - at average cost 216,145 208,584
Materials and supplies - at average cost 776,170 692,376
Deferred nuclear refueling outage costs 221,803 172,936
System agreement cost equalization 394,000 268,000
Prepayments and other 247,184 129,162
Total 5,160,389 3,958,247
OTHER PROPERTY AND INVESTMENTS
Investment in affiliates - at equity 66,247 78,992
Decommissioning trust funds 2,832,243 3,307,636
Non-utility property - at cost (less accumulated depreciation) 231,115 220,204
Other 107,939 82,563
Total 3,237,544 3,689,395
PROPERTY, PLANT AND EQUIPMENT
Electric 34,495,406 32,959,022
Property under capital lease 745,504 740,095
Natural gas 303,769 300,767
Construction work in progress 1,712,761 1,054,833
Nuclear fuel under capital lease 465,374 361,502
Nuclear fuel 636,813 665,620
Total property, plant and equipment 38,359,627 36,081,839
Less - accumulated depreciation and amortization 15,930,513 15,107,569
Property, plant and equipment - net 22,429,114 20,974,270
DEFERRED DEBITS AND OTHER ASSETS
Regulatory assets:
SFAS 109 regulatory asset - net 581,719 595,743
Other regulatory assets 3,615,104 2,971,399
Deferred fuel costs 168,122 168,122
Goodwill 377,172 377,172
Other 1,047,654 908,654
Total 5,789,771 5,021,090
TOTAL ASSETS $36,616,818 $33,643,002
See Notes to Financial Statements.