Entergy 2008 Annual Report Download - page 3
Download and view the complete annual report
Please find page 3 of the 2008 Entergy annual report below. You can navigate through the pages in the report by either clicking on the pages listed below, or by using the keyword search tool below to find specific information within the annual report.-
 1
1 -
 2
2 -
 3
3 -
 4
4 -
 5
5 -
 6
6 -
 7
7 -
 8
8 -
 9
9 -
 10
10 -
 11
11 -
 12
12 -
 13
13 -
 14
14 -
15
-
16
-
17
-
18
-
19
-
20
-
21
-
22
-
23
-
24
-
25
-
26
-
27
-
28
-
29
-
30
-
31
-
32
-
33
-
34
-
35
-
36
-
37
-
38
-
39
-
40
-
41
-
42
-
43
-
44
-
45
-
46
-
47
-
48
-
49
-
50
-
51
-
52
-
53
-
54
-
55
-
56
-
57
-
58
-
59
-
60
-
61
-
62
-
63
-
64
-
65
-
66
-
67
-
68
-
69
-
70
-
71
-
72
-
73
-
74
-
75
-
76
-
77
-
78
-
79
-
80
-
81
-
82
-
83
-
84
-
85
-
86
-
87
-
88
-
89
-
90
-
91
-
92
-
93
-
94
-
95
-
96
-
97
-
98
-
99
-
100
-
101
-
102
-
103
-
104
-
105
-
106
-
107
-
108
 |
 |

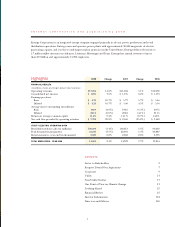
Entergy Corporation is an integrated energy company engaged primarily in electric power production and retail
distribution operations. Entergy owns and operates power plants with approximately 30,000 megawatts of electric
generating capacity, and it is the second-largest nuclear generator in the United States. Entergy delivers electricity to
2.7 million utility customers in Arkansas, Louisiana, Mississippi and Texas. Entergy has annual revenues of more
than $13 billion and approximately 14,700 employees.
ENTERGY CORPORATION AND SUBSIDIARIES 2008
CONTENTS
Letter to Stakeholders 2
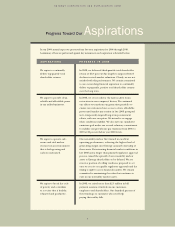
Progress Toward Our Aspirations 7
Corporate 9
Utility 13
Non-Utility Nuclear 17
Our Point of View on Climate Change 21
Looking Ahead 25
Financial Review 25
Investor Information 104
Directors and Officers 105
Highlights
2008 Change 2007 Change 2006
FINANCIAL RESULTS
(in millions, except percentages and per share amounts)
Operating revenues $13,094 14.0% $11,484 5.1% $10,932
Consolidated net income $ 1,221 7.6% $ 1,135 0.2% $ 1,133
Earnings per share
Basic $ 6.39 10.7% $ 5.77 5.7% $ 5.46
Diluted $ 6.20 10.7% $ 5.60 4.5% $ 5.36
Average shares outstanding (in millions)
Basic 190.9 (2.9%) 196.6 (5.3%) 207.5
Diluted 201.0 (0.9%) 202.8 (4.1%) 211.5
Return on average common equity 15.4% 9.2% 14.1% (0.7%) 14.2%
Net cash flow provided by operating activities $ 3,324 29.8% $ 2,560 (25.8%) $ 3,448
UTILITY ELECTRIC OPERATING DATA
Retail kilowatt-hour sales (in millions) 100,609 (1.4%) 102,013 5.5% 96,663
Peak demand (in megawatts) 21,241 (3.5%) 22,001 5.3% 20,887
Retail customers - year end (in thousands) 2,689 0.8% 2,668 2.8% 2,595
TOTAL EMPLOYEES - YEAR END 14,669 2.4% 14,322 3.7% 13,814
1