Entergy 2008 Annual Report Download - page 103
Download and view the complete annual report
Please find page 103 of the 2008 Entergy annual report below. You can navigate through the pages in the report by either clicking on the pages listed below, or by using the keyword search tool below to find specific information within the annual report.-
 1
1 -
2
-
3
-
4
-
5
-
6
-
7
-
8
-
9
-
10
-
11
-
12
-
13
-
14
-
15
-
16
-
17
-
18
-
19
-
20
-
21
-
22
-
23
-
24
-
25
-
26
-
27
-
28
-
29
-
30
-
31
-
32
-
33
-
34
-
35
-
36
-
37
-
38
-
39
-
40
-
41
-
42
-
43
-
44
-
45
-
46
-
47
-
48
-
49
-
50
-
51
-
52
-
53
-
54
-
55
-
56
-
57
-
58
-
59
-
60
-
61
-
62
-
63
-
64
-
65
-
66
-
67
-
68
-
69
-
70
-
71
-
72
-
73
-
74
-
75
-
76
-
77
-
78
-
79
-
80
-
81
-
82
-
83
-
84
-
85
-
86
-
87
-
88
-
89
-
90
-
91
-
92
-
 93
93 -
 94
94 -
 95
95 -
 96
96 -
 97
97 -
 98
98 -
 99
99 -
 100
100 -
 101
101 -
 102
102 -
 103
103 -
 104
104 -
 105
105 -
 106
106 -
 107
107 -
 108
108
 |
 |

101101
ENTERGY CORPORATION AND SUBSIDIARIES 2008
101
Notes to Consolidated Financial Statements continued
101
Notes to Consolidated Financial Statements continued
SFAS 157 establishes a fair value hierarchy that prioritizes the
inputs used to measure fair value. The hierarchy establishes the
highest priority for unadjusted market quotes in an active market for
the identical asset or liability and the lowest priority for unobservable
inputs. The three levels of fair value hierarchy defined in SFAS 157
are as follows:
nLevel 1 - Level 1 inputs are unadjusted quoted prices in active
markets for identical assets or liabilities that the entity has the
ability to access at the measurement date. Active markets are
those in which transactions for the asset or liability occur in
sufficient frequency and volume to provide pricing information
on an ongoing basis. Level 1 primarily consists of individually
owned common stocks, cash equivalents, debt instruments, and
gas hedge contracts.
nLevel 2 - Level 2 inputs are inputs other than quoted prices
included in level 1 that are, either directly or indirectly,
observable for the asset or liability at the measurement date.
Level 2 inputs include the following:
nquoted prices for similar assets or liabilities in active markets;
nquoted prices for identical assets or liabilities in inactive
markets;
ninputs other than quoted prices that are observable for the
asset or liability; or
ninputs that are derived principally from or corroborated by
observable market data by correlation or other means.
Level 2 consists primarily of individually owned debt instruments
or shares in common trusts.
nLevel 3 - Level 3 inputs are pricing inputs that are generally
less observable or unobservable from objective sources. These
inputs are used with internally developed methodologies to
produce management’s best estimate of fair value for the
asset or liability. Level 3 consists primarily of derivative power
contracts used as cash flow hedges of power sales at unregulated
power plants.
The values for the cash flow hedges that are recorded as derivative
contract assets or liabilities are based on both observable inputs
including public market prices and unobservable inputs such as
model-generated prices for longer-term markets and are classified
as Level 3 assets and liabilities. The amounts reflected as the fair
value of derivative assets or liabilities are based on the estimated
amount that the contracts are in-the-money at the balance sheet
date (treated as an asset) or out-of-the-money at the balance sheet
date (treated as a liability) and would equal the estimated amount
receivable from or payable to Entergy if the contracts were settled
at that date. These derivative contracts include cash flow hedges
that swap fixed for floating cash flows for sales of the output from
Entergy’s Non-Utility Nuclear business. The fair values are based on
the mark-to-market comparison between the fixed contract prices
and the floating prices determined each period from a combination
of quoted forward power market prices for the period for which
such curves are available, and model-generated prices using quoted
forward gas market curves and estimates regarding heat rates to
convert gas to power and the costs associated with the transportation
of the power from the plants’ busbar to the contract’s point of
delivery, generally a power market hub, for the period thereafter.
The difference between the fixed price in the swap contract and
these market-related prices multiplied by the volume specified in
the contract and discounted at the counterparties’ credit adjusted
risk free rate are recorded as derivative contract assets or liabilities.
All of the $207 million net assets at December 31, 2008 are in-
the-money contracts with counterparties who are currently all
investment grade.
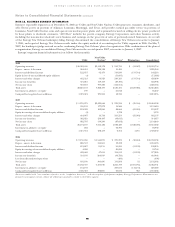
The following table sets forth, by level within the fair value
hierarchy established by SFAS 157, Entergy’s assets and liabilities that
are accounted for at fair value on a recurring basis as of December
31, 2008. The assessment of the significance of a particular input to
a fair value measurement requires judgment and may affect their
placement within the fair value hierarchy levels (in millions):
Level 1 Level 2 Level 3 Total
Assets:
Temporary cash investments $1,805 $ – $ – $1,805
Decommissioning trust funds 508 2,324 – 2,832
Power contracts – – 207 207
Securitization recovery trust account 12 – – 12
Other investments 35 – – 35
$2,360 $2,324 $207 $4,891
Liabilities:
Gas hedge contracts $ 67 $ – $ – $ 67
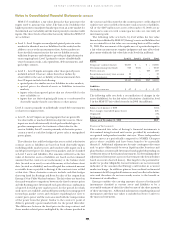
The following table sets forth a reconciliation of changes in the
assets (liabilities) for the fair value of derivatives classified as level
3 in the SFAS 157 fair value hierarchy in 2008 (in millions):
Balance as of January 1, 2008 $(12)
Price changes (unrealized gains/losses) 226
Originated (70)
Settlements 63
Balance as of December 31, 2008 $207
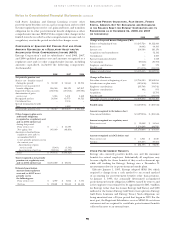
Financial Instruments
The estimated fair value of Entergy’s financial instruments is
determined using forward mid curves provided by an industry
recognized independent market surveyor. These independent
market curves are periodically compared to NYMEX Clearport
prices where available and have been found to be materially
identical. Additional adjustments for unit contingent discounts
and/or price differentials between liquid market locations and
plant busbars are internally determined and applied depending on
settlement terms of the financial instrument. In determining these
adjustments, Entergy uses a process that estimates the forward values
based on recent observed history. Due largely to the potential for
market or product illiquidity, forward estimates are not necessarily
indicative of the amounts that Entergy could realize in a current
market exchange. In addition, gains or losses realized on financial
instruments held by regulated businesses may be reflected in future
rates and therefore do not necessarily accrue to the benefit or
detriment of stockholders.
Entergy considers the carrying amounts of most of its financial
instruments classified as current assets and liabilities to be a
reasonable estimate of their fair value because of the short maturity
of these instruments. Additional information regarding financial
instruments and their fair values is included in Notes 5 and 6 to
the financial statements.