Entergy 2008 Annual Report Download - page 34
Download and view the complete annual report
Please find page 34 of the 2008 Entergy annual report below. You can navigate through the pages in the report by either clicking on the pages listed below, or by using the keyword search tool below to find specific information within the annual report.-
 1
1 -
2
-
3
-
4
-
5
-
6
-
7
-
8
-
9
-
10
-
11
-
12
-
13
-
14
-
15
-
16
-
17
-
18
-
19
-
20
-
21
-
22
-
23
-
 24
24 -
 25
25 -
 26
26 -
 27
27 -
 28
28 -
 29
29 -
 30
30 -
 31
31 -
 32
32 -
 33
33 -
 34
34 -
 35
35 -
 36
36 -
 37
37 -
 38
38 -
 39
39 -
 40
40 -
 41
41 -
 42
42 -
 43
43 -
 44
44 -
45
-
46
-
47
-
48
-
49
-
50
-
51
-
52
-
53
-
54
-
55
-
56
-
57
-
58
-
59
-
60
-
61
-
62
-
63
-
64
-
65
-
66
-
67
-
68
-
69
-
70
-
71
-
72
-
73
-
74
-
75
-
76
-
77
-
78
-
79
-
80
-
81
-
82
-
83
-
84
-
85
-
86
-
87
-
88
-
89
-
90
-
91
-
92
-
93
-
94
-
95
-
96
-
97
-
98
-
99
-
100
-
101
-
102
-
103
-
104
-
105
-
106
-
107
-
108
 |
 |

32
ENTERGY CORPORATION AND SUBSIDIARIES 2008
32
Management’s Financial Discussion and Analysis continued
As shown in the table above, net revenue for Non-Utility
Nuclear increased by $495 million, or 27%, in 2008 compared to
2007 primarily due to higher pricing in its contracts to sell power,
additional production available from the acquisition of Palisades
in April 2007, and fewer outage days. In addition to the refueling
outages shown in the table below, 2007 was affected by a 28 day
unplanned outage. Included in the Palisades net revenue is $76
million and $50 million of amortization of the Palisades purchased
power agreement in 2008 and 2007, respectively, which is non-cash
revenue and is discussed in Note 15 to the financial statements.
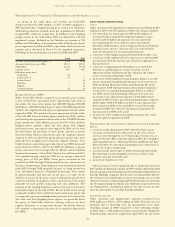
Following are key performance measures for 2008 and 2007:
2008 2007
Net MW in operation at December 31 4,998 4,998
Average realized price per MWh $59.51 $52.69
GWh billed 41,710 37,570
Capacity factor 95% 89%
Refueling outage days:
FitzPatrick 26 –
Indian Point 2 26 –
Indian Point 3 – 24
Palisades – 42
Pilgrim – 33
Vermont Yankee 22 24
Realized Price per MWh
When Non-Utility Nuclear acquired its six nuclear power plants
it also entered into purchased power agreements with each of
the sellers. For four of the plants, the 688 MW Pilgrim, 838 MW
FitzPatrick, 1,028 MW Indian Point 2, and 1,041 MW Indian Point
3 plants, the original purchased power agreements with the sellers
expired in 2004. The purchased power agreement with the seller
of the 605 MW Vermont Yankee plant extends into 2012, and the
purchased power agreement with the seller of the 798 MW Palisades
plant extends into 2022. Market prices in the New York and New
England power markets, where the four plants with original
purchased power agreements that expired in 2004 are located,
increased since the purchase of these plants, and the contracts
that Non-Utility Nuclear entered into after the original contracts
expired, as well as realized day ahead and spot market sales, have
generally been at higher prices than the original contracts. Non-
Utility Nuclear’s annual average realized price per MWh increased
from $39.40 for 2003 to $59.51 for 2008. In addition, as shown
in the contracted sale of energy table in “Market and Credit Risk
Sensitive Instruments,” Non-Utility Nuclear has sold forward 86%
of its planned energy output for 2009 for an average contracted
energy price of $61 per MWh. Power prices increased in the
period from 2003 through 2008 primarily because of increases in
the price of natural gas. Natural gas prices increased in the period
from 2003 through 2008 primarily because of rising production
costs and limited imports of liquefied natural gas, both caused
by global demand and increases in the price of crude oil. In
addition, increases in the price of power during this period were
caused secondarily by rising heat rates, which in turn were caused
primarily by load growth outpacing new unit additions. The
majority of the existing long-term contracts for power from these
four plants expire by the end of 2011. Recent trends in the energy
commodity markets have resulted in lower natural gas prices and
consequently current prevailing market prices for electricity in the
New York and New England power regions are generally below
the prices in Non-Utility Nuclear’s existing contracts in those
regions. Therefore, it is uncertain whether Non-Utility Nuclear
will continue to experience increases in its annual realized price
per MWh.
Other Income Statement Items
Utility
Other operation and maintenance expenses increased from $1,856
million for 2007 to $1,867 million for 2008. The variance includes:
nthe write-off in the fourth quarter 2008 of $52 million of
costs previously accumulated in Entergy Arkansas’s storm
reserve and $16 million of removal costs associated with
the termination of a lease, both in connection with the
December 2008 Arkansas Court of Appeals decision in Entergy
Arkansas’ base rate case. The base rate case is discussed in
more detail in Note 2 to the financial statements;
na decrease of $39 million in payroll-related and benefits costs;
na decrease of $21 million related to expenses recorded in 2007
in connection with the nuclear operations fleet alignment, as
discussed above;
na decrease of approximately $23 million as a result of the
deferral or capitalization of storm restoration costs for
Hurricane Gustav and Hurricane Ike, which hit the Utility’s
service territories in September 2008;
nan increase of $18 million in storm damage charges as a result
of several storms hitting Entergy Arkansas’ service territory in
2008, including Hurricane Gustav and Hurricane Ike in the
third quarter 2008. Entergy Arkansas discontinued regulatory
storm reserve accounting beginning July 2007 as a result of
the APSC order issued in Entergy Arkansas’ base rate case.
As a result, non-capital storm expenses of $41 million were
charged in 2008 to other operation and maintenance expenses.
In December 2008, $19 million of these storm expenses were
deferred per an APSC order and will be recovered through
revenues in 2009. See Note 2 to the financial statements for
discussion of the APSC order; and
nan increase of $17 million in fossil plant expenses due to the
Ouachita plant acquisition in 2008.
Depreciation and amortization expenses increased primarily
due to:
na revision in the third quarter 2007 related to depreciation
on storm cost-related assets. Recoveries of the costs of those
assets are now through the Act 55 financing of storm costs, as
approved by the LPSC in the third quarter 2007. See “Liquidity
and Capital Resources - Hurricane Katrina and Hurricane Rita”
below and Note 2 to the financial statements for a discussion of
the Act 55 storm cost financing;
na revision in the fourth quarter 2008 of estimated depreciable
lives involving certain intangible assets in accordance with
formula rate plan treatment; and
nan increase in plant in service.
Other income increased primarily due to dividends earned of
$29.5 million by Entergy Louisiana and $10.3 million by Entergy Gulf
States Louisiana on investments in preferred membership interests of
Entergy Holdings Company. This increase was substantially offset by
the cessation of carrying charges on storm restoration costs as a result
of the Act 55 storm cost financing in 2007 and lower interest earned on
the decommissioning trust funds. The dividends on preferred stock
are eliminated in consolidation and have no effect on net income
since the investment is in another Entergy subsidiary.
Non-Utility Nuclear
Other operation and maintenance expenses increased from
$760 million in 2007 to $773 million in 2008. This increase was
primarily due to deferring costs for amortization from three
refueling outages in 2008 compared to four refueling outages
in 2007 and to a $34 million increase associated with owning the
Palisades plant, which was acquired in April 2007, for the entire
32
ENTERGY CORPORATION AND SUBSIDIARIES 2008
Management’s Financial Discussion and Analysis continued