Entergy 2008 Annual Report Download - page 36
Download and view the complete annual report
Please find page 36 of the 2008 Entergy annual report below. You can navigate through the pages in the report by either clicking on the pages listed below, or by using the keyword search tool below to find specific information within the annual report.-
 1
1 -
2
-
3
-
4
-
5
-
6
-
7
-
8
-
9
-
10
-
11
-
12
-
13
-
14
-
15
-
16
-
17
-
18
-
19
-
20
-
21
-
22
-
23
-
24
-
25
-
 26
26 -
 27
27 -
 28
28 -
 29
29 -
 30
30 -
 31
31 -
 32
32 -
 33
33 -
 34
34 -
 35
35 -
 36
36 -
 37
37 -
 38
38 -
 39
39 -
 40
40 -
 41
41 -
 42
42 -
 43
43 -
 44
44 -
 45
45 -
 46
46 -
47
-
48
-
49
-
50
-
51
-
52
-
53
-
54
-
55
-
56
-
57
-
58
-
59
-
60
-
61
-
62
-
63
-
64
-
65
-
66
-
67
-
68
-
69
-
70
-
71
-
72
-
73
-
74
-
75
-
76
-
77
-
78
-
79
-
80
-
81
-
82
-
83
-
84
-
85
-
86
-
87
-
88
-
89
-
90
-
91
-
92
-
93
-
94
-
95
-
96
-
97
-
98
-
99
-
100
-
101
-
102
-
103
-
104
-
105
-
106
-
107
-
108
 |
 |

34
ENTERGY CORPORATION AND SUBSIDIARIES 2008
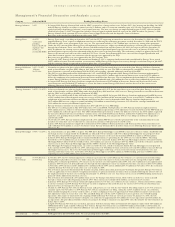
Management’s Financial Discussion and Analysis continued
34
As discussed above, Entergy New Orleans was reconsolidated
retroactive to January 1, 2007 and its results are included in each
individual income statement line item for 2007. The variance
explanations for the Utility for 2007 compared to 2006 in “Results
of Operations” reflect the 2006 results of operations of Entergy
New Orleans as if it were reconsolidated in 2006, consistent with
the 2007 presentation including the results in each individual
income statement line item. Entergy’s as-reported results for
2006, which had Entergy New Orleans deconsolidated, and the
amounts needed to reconsolidate Entergy New Orleans, which
include intercompany items, are set forth in the table below
(in thousands):
For the Year Ended December 31, 2006
Entergy
Corporation Entergy
and Subsidiaries New Orleans
(as-reported) adjustment*
Operating revenues $10,932,158 $305,077
Operating expenses:
Fuel, fuel-related, and gas purchased
for resale and purchased power 5,282,310 113,888
Other operation and maintenance 2,335,364 100,094
Taxes other than income taxes 428,561 34,953
Depreciation and amortization 887,792 31,465
Other regulatory charges (credits) - net (122,680) 4,160
Other operating expenses 315,451 169
Total operating expenses $ 9,126,798 $284,729
Other income $ 348,587 $ (8,244)
Interest and other charges $ 577,805 $ 7,053
Income from continuing operations
before income taxes $ 1,576,142 $ 5,051
Income taxes $ 443,044 $ 5,051
Consolidated Net Income $ 1,132,602 $ –
* Reflects the adjustment needed to reconsolidate Entergy New Orleans
for 2006. The adjustment includes intercompany eliminations.
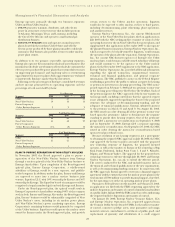
Net Revenue
Utility
Following is an analysis of the change in net revenue comparing
2007 to 2006 (in millions):
2006 Net Revenue (includes $187 million for
Entergy New Orleans) $4,458
Retail electric price 90
Volume/weather 89
Fuel recovery 52
Transmission revenue 38
Purchased power capacity (90)
Net wholesale revenue (59)
Other 40
2007 Net Revenue $4,618
The retail electric price variance resulted from rate increases
primarily at Entergy Louisiana effective September 2006 for
the 2005 formula rate plan filing to recover LPSC-approved
incremental deferred and ongoing purchased power capacity
costs. The formula rate plan filing is discussed in Note 2 to the
financial statements.
The volume/weather variance resulted primarily from increased
electricity usage in the residential and commercial sectors,
including increased usage during the unbilled sales period.
Billed retail electricity usage increased by a total of 1,591 GWh,
an increase of 1.6%. See “Critical Accounting Estimates” herein
and Note 1 to the financial statements for a discussion of the
accounting for unbilled revenues.
The fuel recovery variance is primarily due to the inclusion of
Grand Gulf costs in Entergy New Orleans’ fuel recoveries effective
July 1, 2006. In June 2006, the City Council approved the recovery
of Grand Gulf costs through the fuel adjustment clause, without
a corresponding change in base rates (a significant portion of
Grand Gulf costs was previously recovered through base rates).
The increase is also due to purchased power costs deferred at
Entergy Louisiana and Entergy New Orleans as a result of the
re-pricing, retroactive to 2003, of purchased power agreements
among Entergy system companies as directed by the FERC.
The transmission revenue variance is due to higher rates and
the addition of new transmission customers in late-2006.
The purchased power capacity variance is due to higher capacity
charges and new purchased power contracts that began in mid-
2006. A portion of the variance is due to the amortization of
deferred capacity costs and is offset in base revenues due to base
rate increases implemented to recover incremental deferred and
ongoing purchased power capacity charges at Entergy Louisiana,
as discussed above.
The net wholesale revenue variance is due primarily to 1) more
energy available for resale at Entergy New Orleans in 2006 due to
the decrease in retail usage caused by customer losses following
Hurricane Katrina and 2) the inclusion in 2006 revenue of sales
into the wholesale market of Entergy New Orleans’ share of
the output of Grand Gulf, pursuant to City Council approval
of measures proposed by Entergy New Orleans to address the
reduction in Entergy New Orleans’ retail customer usage caused
by Hurricane Katrina and to provide revenue support for the costs
of Entergy New Orleans’ share of Grand Gulf. The net wholesale
revenue variance is partially offset by the effect of lower wholesale
revenues in the third quarter 2006 due to an October 2006 FERC
order requiring Entergy Arkansas to make a refund to a coal plant
co-owner resulting from a contract dispute.
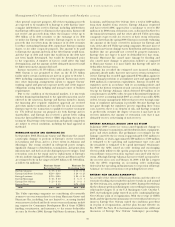
Non-Utility Nuclear
Following is an analysis of the change in net revenue comparing
2007 to 2006 (in millions):
2006 Net Revenue $1,388
Realized price changes 264
Palisades acquisition 209
Volume variance (other than Palisades) (56)
Other 34
2007 Net Revenue $1,839
As shown in the table above, net revenue increased for Non-
Utility Nuclear by $451 million, or 33%, for 2007 compared to
2006 primarily due to higher pricing in its contracts to sell power
and additional production available resulting from the acquisition
of the Palisades plant in April 2007. Included in the Palisades net
revenue is $50 million of amortization of the Palisades purchased
power agreement in 2007, which is non-cash revenue and is
discussed in Note 15 to the financial statements. The increase was
partially offset by the effect on revenues of four refueling outages
in 2007 compared to two in 2006. Following are key performance
measures for Non-Utility Nuclear for 2007 and 2006:
2007 2006
Net MW in operation at December 31 4,998 4,200
Average realized price per MWh $52.69 $44.33
GWh billed 37,570 34,847
Capacity factor 89% 95%
Refueling outage days:
FitzPatrick – 27
Indian Point 2 – 31
Indian Point 3 24 –
Palisades 42 –
Pilgrim 33 –
Vermont Yankee 24 –