Cincinnati Bell 2006 Annual Report Download - page 7
Download and view the complete annual report
Please find page 7 of the 2006 Cincinnati Bell annual report below. You can navigate through the pages in the report by either clicking on the pages listed below, or by using the keyword search tool below to find specific information within the annual report.-
 1
1 -
 2
2 -
 3
3 -
 4
4 -
 5
5 -
 6
6 -
 7
7 -
 8
8 -
 9
9 -
 10
10 -
 11
11 -
 12
12 -
 13
13 -
 14
14 -
 15
15 -
 16
16 -
 17
17 -
 18
18 -
19
-
20
-
21
-
22
-
23
-
24
-
25
-
26
-
27
-
28
-
29
-
30
-
31
-
32
-
33
-
34
-
35
-
36
-
37
-
38
-
39
-
40
-
41
-
42
-
43
-
44
-
45
-
46
-
47
-
48
-
49
-
50
-
51
-
52
-
53
-
54
-
55
-
56
-
57
-
58
-
59
-
60
-
61
-
62
-
63
-
64
-
65
-
66
-
67
-
68
-
69
-
70
-
71
-
72
-
73
-
74
-
75
-
76
-
77
-
78
-
79
-
80
-
81
-
82
-
83
-
84
-
85
-
86
-
87
-
88
-
89
-
90
-
91
-
92
-
93
-
94
-
95
-
96
-
97
-
98
-
99
-
100
-
101
-
102
-
103
-
104
-
105
-
106
-
107
-
108
-
109
-
110
-
111
-
112
-
113
-
114
-
115
-
116
-
117
-
118
-
119
-
120
-
121
-
122
-
123
-
124
-
125
-
126
-
127
-
128
-
129
-
130
-
131
-
132
-
133
-
134
-
135
-
136
-
137
-
138
-
139
-
140
-
141
-
142
-
143
-
144
-
145
-
146
-
147
-
148
-
149
-
150
-
151
-
152
-
153
-
154
-
155
-
156
-
157
-
158
-
159
-
160
-
161
-
162
-
163
-
164
-
165
-
166
-
167
-
168
-
169
-
170
-
171
-
172
-
173
-
174
-
175
-
176
-
177
-
178
-
179
-
180
-
181
-
182
-
183
-
184
-
185
-
186
-
187
-
188
-
189
-
190
-
191
-
192
-
193
-
194
-
195
-
196
-
197
-
198
-
199
-
200
-
201
-
202
-
203
-
204
-
205
-
206
-
207
-
208
-
209
-
210
-
211
-
212
-
213
-
214
-
215
-
216
-
217
-
218
-
219
-
220
-
221
-
222
-
223
-
224
-
225
-
226
-
227
-
228
 |
 |

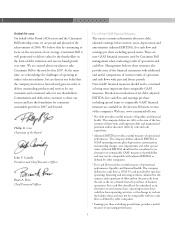
Outlook for 2007
On behalf of the Board of Directors and the Cincinnati
Bell leadership team, we are proud and pleased of the
achievements of 2006. We believe that by continuing to
focus on the execution of our strategy, Cincinnati Bell is
well positioned to deliver value for the shareholders in
the form of debt reduction and success-based growth
over time. We are excited about our plans to take
Cincinnati Bell to the next level in 2007. At the same
time, we acknowledge the challenges of operating in
today’s telecom industry, but are firm in our belief that
the company must move forward and grow in order to
deliver outstanding products and services for our
customers and continued value for our shareholders.
Commitment and dedication continues to drive our
success and lays the foundation for consistent
sustainable growth in 2007 and beyond.
Phillip R. Cox
Chairman of the Board
John F. Cassidy
President and Chief Executive Officer
Brian A. Ross
Chief Financial Officer
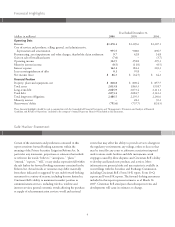
Use of Non-GAAP Financial Measures
The report contains information about net debt,
adjusted earnings before interest, taxes, depreciation and
amortization (adjusted EBITDA), free cash flow and
earnings per share excluding special items. These are
non-GAAP financial measures used by Cincinnati Bell
management when evaluating results of operations and
cash flow. Management believes these measures also
provide users of the financial statements with additional
and useful comparisons of current results of operations
and cash flows with past and future periods.
Non-GAAP financial measures should not be construed
as being more important than comparable GAAP
measures. Detailed reconciliations of net debt, adjusted
EBITDA, free cash flow and earnings per share
excluding special items to comparable GAAP financial
measures are available in the Investor Relations section
of the company’s Web site, www.cincinnatibell.com.
1Net debt provides a useful measure of liquidity and financial
health. The company defines net debt as the sum of the face
amount of short-term and long-term debt and unamortized
premium and/or discount, offset by cash and cash
equivalents.
2Adjusted EBITDA provides a useful measure of operational
performance. The company defines adjusted EBITDA as
GAAP operating income plus depreciation, amortization,
restructuring charges, asset impairments and other special
items. Adjusted EBITDA should not be considered as an
alternative to comparable GAAP measures of profitability
and may not be comparable with adjusted EBITDA as
defined by other companies.
3Free cash flow provides a useful measure of operational
performance, liquidity and financial health. The company
defines free cash flow as SFAS 95 cash provided by (used in)
operating, financing and investing activities, adjusted for the
issuance and repayment of debt and for the proceeds from
the sale or the use of funds from the purchase of business
operations. Free cash flow should not be considered as an
alternative to net income (loss), operating income (loss),
cash flow from operating activities, or the change in cash on
the balance sheet and may not be comparable with free cash
flow as defined by other companies.
4Earnings per share excluding special items provides a useful
measure of operating performance.
5