Cincinnati Bell 2006 Annual Report Download - page 213
Download and view the complete annual report
Please find page 213 of the 2006 Cincinnati Bell annual report below. You can navigate through the pages in the report by either clicking on the pages listed below, or by using the keyword search tool below to find specific information within the annual report.-
 1
1 -
2
-
3
-
4
-
5
-
6
-
7
-
8
-
9
-
10
-
11
-
12
-
13
-
14
-
15
-
16
-
17
-
18
-
19
-
20
-
21
-
22
-
23
-
24
-
25
-
26
-
27
-
28
-
29
-
30
-
31
-
32
-
33
-
34
-
35
-
36
-
37
-
38
-
39
-
40
-
41
-
42
-
43
-
44
-
45
-
46
-
47
-
48
-
49
-
50
-
51
-
52
-
53
-
54
-
55
-
56
-
57
-
58
-
59
-
60
-
61
-
62
-
63
-
64
-
65
-
66
-
67
-
68
-
69
-
70
-
71
-
72
-
73
-
74
-
75
-
76
-
77
-
78
-
79
-
80
-
81
-
82
-
83
-
84
-
85
-
86
-
87
-
88
-
89
-
90
-
91
-
92
-
93
-
94
-
95
-
96
-
97
-
98
-
99
-
100
-
101
-
102
-
103
-
104
-
105
-
106
-
107
-
108
-
109
-
110
-
111
-
112
-
113
-
114
-
115
-
116
-
117
-
118
-
119
-
120
-
121
-
122
-
123
-
124
-
125
-
126
-
127
-
128
-
129
-
130
-
131
-
132
-
133
-
134
-
135
-
136
-
137
-
138
-
139
-
140
-
141
-
142
-
143
-
144
-
145
-
146
-
147
-
148
-
149
-
150
-
151
-
152
-
153
-
154
-
155
-
156
-
157
-
158
-
159
-
160
-
161
-
162
-
163
-
164
-
165
-
166
-
167
-
168
-
169
-
170
-
171
-
172
-
173
-
174
-
175
-
176
-
177
-
178
-
179
-
180
-
181
-
182
-
183
-
184
-
185
-
186
-
187
-
188
-
189
-
190
-
191
-
192
-
193
-
194
-
195
-
196
-
197
-
198
-
199
-
200
-
201
-
202
-
 203
203 -
 204
204 -
 205
205 -
 206
206 -
 207
207 -
 208
208 -
 209
209 -
 210
210 -
 211
211 -
 212
212 -
 213
213 -
 214
214 -
 215
215 -
 216
216 -
 217
217 -
 218
218 -
 219
219 -
 220
220 -
 221
221 -
 222
222 -
 223
223 -
224
-
225
-
226
-
227
-
228
 |
 |

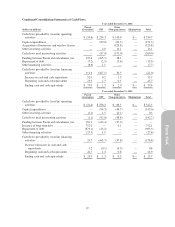
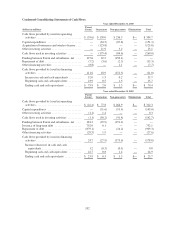
Year ended December 31, 2004
(dollars in millions)
Parent
(Issuer) Guarantors Non-guarantors Eliminations Total
Cash flows provided by (used in) operating
activities ................................ $ (33.6) $119.3 $ 215.0 $— $ 300.7
Capital expenditures ........................ — (55.1) (78.8) — (133.9)
Proceeds from sale of assets .................. — 3.3 — — 3.3
Other investing activities ..................... 3.3 — 3.0 — 6.3
Cash flows provided by (used in) investing
activities ................................ 3.3 (51.8) (75.8) — (124.3)
Funding between Parent and subsidiaries, net .... 206.8 (68.3) (138.5) — —
Repayment of debt .......................... (169.5) 0.7 (3.0) — (171.8)
Other financing activities .................... (7.8) — 2.1 — (5.7)
Cash flows provided by (used in) financing
activities ................................ 29.5 (67.6) (139.4) — (177.5)
Decrease in cash and cash equivalents ........ (0.8) (0.1) (0.2) — (1.1)
Beginning cash and cash equivalents ......... 23.5 0.9 1.6 — 26.0
Ending cash and cash equivalents ............ $ 22.7 $ 0.8 $ 1.4 $— $ 24.9
103