Cincinnati Bell 2006 Annual Report Download - page 134
Download and view the complete annual report
Please find page 134 of the 2006 Cincinnati Bell annual report below. You can navigate through the pages in the report by either clicking on the pages listed below, or by using the keyword search tool below to find specific information within the annual report.-
 1
1 -
2
-
3
-
4
-
5
-
6
-
7
-
8
-
9
-
10
-
11
-
12
-
13
-
14
-
15
-
16
-
17
-
18
-
19
-
20
-
21
-
22
-
23
-
24
-
25
-
26
-
27
-
28
-
29
-
30
-
31
-
32
-
33
-
34
-
35
-
36
-
37
-
38
-
39
-
40
-
41
-
42
-
43
-
44
-
45
-
46
-
47
-
48
-
49
-
50
-
51
-
52
-
53
-
54
-
55
-
56
-
57
-
58
-
59
-
60
-
61
-
62
-
63
-
64
-
65
-
66
-
67
-
68
-
69
-
70
-
71
-
72
-
73
-
74
-
75
-
76
-
77
-
78
-
79
-
80
-
81
-
82
-
83
-
84
-
85
-
86
-
87
-
88
-
89
-
90
-
91
-
92
-
93
-
94
-
95
-
96
-
97
-
98
-
99
-
100
-
101
-
102
-
103
-
104
-
105
-
106
-
107
-
108
-
109
-
110
-
111
-
112
-
113
-
114
-
115
-
116
-
117
-
118
-
119
-
120
-
121
-
122
-
123
-
 124
124 -
 125
125 -
 126
126 -
 127
127 -
 128
128 -
 129
129 -
 130
130 -
 131
131 -
 132
132 -
 133
133 -
 134
134 -
 135
135 -
 136
136 -
 137
137 -
 138
138 -
 139
139 -
 140
140 -
 141
141 -
 142
142 -
 143
143 -
 144
144 -
145
-
146
-
147
-
148
-
149
-
150
-
151
-
152
-
153
-
154
-
155
-
156
-
157
-
158
-
159
-
160
-
161
-
162
-
163
-
164
-
165
-
166
-
167
-
168
-
169
-
170
-
171
-
172
-
173
-
174
-
175
-
176
-
177
-
178
-
179
-
180
-
181
-
182
-
183
-
184
-
185
-
186
-
187
-
188
-
189
-
190
-
191
-
192
-
193
-
194
-
195
-
196
-
197
-
198
-
199
-
200
-
201
-
202
-
203
-
204
-
205
-
206
-
207
-
208
-
209
-
210
-
211
-
212
-
213
-
214
-
215
-
216
-
217
-
218
-
219
-
220
-
221
-
222
-
223
-
224
-
225
-
226
-
227
-
228
 |
 |
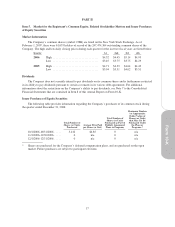
2006 Compared to 2005
Revenue
Voice revenue, which includes local service, switched access, information services and value added services
revenues, decreased by $27.4 million versus 2005 primarily as a result of a 5% decrease in local service access
lines. Access lines within the segment’s ILEC territory decreased by 56,000, or 6%, from 893,000 at
December 31, 2005 to 837,000 at December 31, 2006, which the Company believes results from several factors
including customers electing to use wireless communication in lieu of the traditional local service, Company-
initiated disconnections of customers with credit problems, and customers electing to use service from other
providers. The Company has partially offset its access line loss in its ILEC by targeting voice services to
residential and small business customers in Dayton, Ohio. The Company had 50,000 total access lines outside its
ILEC service territory at December 31, 2006, a 33% increase from the prior year.
Data revenue consists of data transport, high-speed Internet access (including DSL), dial-up Internet access,
digital trunking, and Local Area Network (“LAN”) interconnection services. The increase in data revenue of
$19.0 million for 2006 as compared to 2005 is due to higher DSL revenue and data transport revenue. An
increase in DSL subscribers of 36,000, partially offset by a slightly lower average rate per subscriber, produced
an additional $11.9 million in revenue for 2006 as compared to 2005. Data transport revenues were $5.2 million
higher in 2006 as compared to 2005 due to higher data usage by CBW and third party users. As of December 31,
2006, the Company’s DSL penetration of in-territory primary consumer access lines was approximately 34%, up
from 26% at December 31, 2005.
The Company believes its rate of access line loss would have been greater and its increase in DSL
subscribers would have been less without the success of its Custom ConnectionsSM “Super Bundle.” The
Company added 23,000 Super Bundle subscribers during 2006, bringing total subscribers to 173,000, of which
162,000 were consumer ILEC subscribers, a 32% penetration of primary in-territory consumer access lines. The
Company’s Super Bundle offers local, long distance, wireless, DSL, and the Company’s value-added service
package, Custom Connections®, on a single bill at a price lower than the amount the customer would pay for all
of the services individually. An aggressive marketing campaign and the favorable bundled pricing associated
with Custom ConnectionsSM “Super Bundle” has increased the demand for the Company’s ZoomTown DSL
offering, growing 22% compared to December 31, 2005, to 198,000 subscribers. As a result of this growth, total
lines to the customer (defined as access lines plus DSL subscribers) as of December 31, 2006 decreased only
slightly compared to December 31, 2005, and revenue per household increased 3% to $50.25.
Costs and Expenses
Cost of services and products increased by $1.8 million in 2006 versus 2005. The increase was mainly due
to a $3.5 million increase in non-recurring operating taxes (See Staff Accounting Bulletin No. 108 in Recently
Issued Accounting Standards for further discussion), additional network costs of $1.8 million primarily related to
the increase in subscribers in the CLEC operating area, and an increase of $1.3 million in benefit expense. These
increases were partially offset by lower wages of $4.5 million resulting from the outsourcing of directory
services in 2005 and other Company restructuring initiatives.
Selling, general and administrative expenses increased $3.1 million compared to 2005. Higher costs of $2.9
million primarily related to pension and postretirement costs and $1.6 million for bad debt expense were partially
offset by lower software maintenance and insurance costs.
Depreciation expense decreased $4.4 million in 2006 compared to 2005. The decrease was a result of assets
becoming fully depreciated at a greater rate than capital expenditures.
The Company incurred restructuring charges of $2.8 million primarily related to the outsourcing of certain
supply chain functions in the third quarter of 2006. The Company incurred a $1.5 million charge in 2005 related
to the outsourcing of its directory assistance services. See Note 3 to the Consolidated Financial Statements for
further discussion.
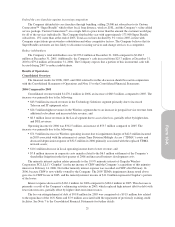
2005 Compared to 2004
Revenue
Voice revenue decreased by $19.4 million versus 2004 as a result of a 4% decrease in local service access
lines as well as the loss of value-added services revenue.
Access lines within the segment’s ILEC territory decreased by 47,000, or 5%, from 940,000 at
December 31, 2004 to 893,000 at December 31, 2005, which the Company believes results from several factors
24