Cincinnati Bell 2006 Annual Report Download - page 4
Download and view the complete annual report
Please find page 4 of the 2006 Cincinnati Bell annual report below. You can navigate through the pages in the report by either clicking on the pages listed below, or by using the keyword search tool below to find specific information within the annual report.-
 1
1 -
 2
2 -
 3
3 -
 4
4 -
 5
5 -
 6
6 -
 7
7 -
 8
8 -
 9
9 -
 10
10 -
 11
11 -
 12
12 -
 13
13 -
 14
14 -
 15
15 -
16
-
17
-
18
-
19
-
20
-
21
-
22
-
23
-
24
-
25
-
26
-
27
-
28
-
29
-
30
-
31
-
32
-
33
-
34
-
35
-
36
-
37
-
38
-
39
-
40
-
41
-
42
-
43
-
44
-
45
-
46
-
47
-
48
-
49
-
50
-
51
-
52
-
53
-
54
-
55
-
56
-
57
-
58
-
59
-
60
-
61
-
62
-
63
-
64
-
65
-
66
-
67
-
68
-
69
-
70
-
71
-
72
-
73
-
74
-
75
-
76
-
77
-
78
-
79
-
80
-
81
-
82
-
83
-
84
-
85
-
86
-
87
-
88
-
89
-
90
-
91
-
92
-
93
-
94
-
95
-
96
-
97
-
98
-
99
-
100
-
101
-
102
-
103
-
104
-
105
-
106
-
107
-
108
-
109
-
110
-
111
-
112
-
113
-
114
-
115
-
116
-
117
-
118
-
119
-
120
-
121
-
122
-
123
-
124
-
125
-
126
-
127
-
128
-
129
-
130
-
131
-
132
-
133
-
134
-
135
-
136
-
137
-
138
-
139
-
140
-
141
-
142
-
143
-
144
-
145
-
146
-
147
-
148
-
149
-
150
-
151
-
152
-
153
-
154
-
155
-
156
-
157
-
158
-
159
-
160
-
161
-
162
-
163
-
164
-
165
-
166
-
167
-
168
-
169
-
170
-
171
-
172
-
173
-
174
-
175
-
176
-
177
-
178
-
179
-
180
-
181
-
182
-
183
-
184
-
185
-
186
-
187
-
188
-
189
-
190
-
191
-
192
-
193
-
194
-
195
-
196
-
197
-
198
-
199
-
200
-
201
-
202
-
203
-
204
-
205
-
206
-
207
-
208
-
209
-
210
-
211
-
212
-
213
-
214
-
215
-
216
-
217
-
218
-
219
-
220
-
221
-
222
-
223
-
224
-
225
-
226
-
227
-
228
 |
 |

large business customers. With data back-up, storage
and recovery requirements mandated by Sarbanes-
Oxley, as well as increased electrical and cooling
requirements needed for the additional servers and
equipment, the demand for collocation and managed
services is growing. Technology Solutions revenue was
up $44 million or 25% in 2006. Hardware accounted
for $32 million with services accounting for
$12 million. Data center services and equipment
revenue rose 28% from 2005.
The growth of 11 cents in earnings per share excluding
special items was due primarily to reduced interest
expense of $22 million from refinancing activities in
2005 and lower depreciation expense, primarily due to
the accelerated depreciation, recorded in 2005, related
to the TDMA network. We continue to anticipate and
explore all opportunities for smarter uses of our cash
and resources.
Bundling brings convenience and savings to our
customers
Bundling continues to be “our right to win” at
Cincinnati Bell, allowing us to attract and retain
customers in a highly competitive market. It provides an
important level of “stickiness” for all of our products
and helps defend against diminishing access lines. For
customers who bundle, the disconnection rate for
services such as wireless and high-speed internet access is
substantially lower than our customers who do not
bundle. This not only indicates a higher rate of
customer satisfaction, but also over time saves sales and
marketing expenses otherwise needed to replace revenue
and profits associated with customer loss.
Super Bundle subscribers increased to 173,000
customers who subscribe to a combination of our local,
long distance, wireless and DSL services, up 23,000 or
15% from a year ago.
Our data centers have become the cornerstone of our
business bundle. In 2006, more than half our total
revenue came from business customers who entrust a
mission critical part of their business with us. Our
superior network quality and cutting-edge managed
infrastructure services provide end-to-end
telecommunications and IT solutions for customers and
lead them to our other high-quality products and
services. This frees up our customers to focus on their
own businesses and leave their telecommunication needs
to us. It helps us to grow our business while also helping
our customers grow theirs.
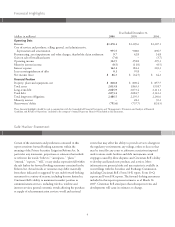
71
30
173
123
150
2005200420032002 2006
Super Bundle Subscribers
(in thousands)
Leading wireless provider with the area’s best network –
2nd year in a row
With regard to what we consider the most important
wireless metric – dropped calls – Cincinnati Bell was far
and away number one, with less than half the dropped
calls of the next best carrier. This commitment to
delivering a superior quality network, in addition to our
ability to bundle unique rate plans, resulted in lower
postpaid churn of 1.6% and higher postpaid net
activations of 51,000 for 2006. Overall wireless revenue
increased 10% year over year driven by a 16% increase
in the postpaid subscriber base and higher postpaid data
usage that is reflected in a 3% improvement in postpaid
ARPU. In addition, new prepaid rate plans were
beginning to have a positive impact on ARPU and
revenue by the end of 2006.
2