Cincinnati Bell 2006 Annual Report Download - page 131
Download and view the complete annual report
Please find page 131 of the 2006 Cincinnati Bell annual report below. You can navigate through the pages in the report by either clicking on the pages listed below, or by using the keyword search tool below to find specific information within the annual report.-
 1
1 -
2
-
3
-
4
-
5
-
6
-
7
-
8
-
9
-
10
-
11
-
12
-
13
-
14
-
15
-
16
-
17
-
18
-
19
-
20
-
21
-
22
-
23
-
24
-
25
-
26
-
27
-
28
-
29
-
30
-
31
-
32
-
33
-
34
-
35
-
36
-
37
-
38
-
39
-
40
-
41
-
42
-
43
-
44
-
45
-
46
-
47
-
48
-
49
-
50
-
51
-
52
-
53
-
54
-
55
-
56
-
57
-
58
-
59
-
60
-
61
-
62
-
63
-
64
-
65
-
66
-
67
-
68
-
69
-
70
-
71
-
72
-
73
-
74
-
75
-
76
-
77
-
78
-
79
-
80
-
81
-
82
-
83
-
84
-
85
-
86
-
87
-
88
-
89
-
90
-
91
-
92
-
93
-
94
-
95
-
96
-
97
-
98
-
99
-
100
-
101
-
102
-
103
-
104
-
105
-
106
-
107
-
108
-
109
-
110
-
111
-
112
-
113
-
114
-
115
-
116
-
117
-
118
-
119
-
120
-
 121
121 -
 122
122 -
 123
123 -
 124
124 -
 125
125 -
 126
126 -
 127
127 -
 128
128 -
 129
129 -
 130
130 -
 131
131 -
 132
132 -
 133
133 -
 134
134 -
 135
135 -
 136
136 -
 137
137 -
 138
138 -
 139
139 -
 140
140 -
 141
141 -
142
-
143
-
144
-
145
-
146
-
147
-
148
-
149
-
150
-
151
-
152
-
153
-
154
-
155
-
156
-
157
-
158
-
159
-
160
-
161
-
162
-
163
-
164
-
165
-
166
-
167
-
168
-
169
-
170
-
171
-
172
-
173
-
174
-
175
-
176
-
177
-
178
-
179
-
180
-
181
-
182
-
183
-
184
-
185
-
186
-
187
-
188
-
189
-
190
-
191
-
192
-
193
-
194
-
195
-
196
-
197
-
198
-
199
-
200
-
201
-
202
-
203
-
204
-
205
-
206
-
207
-
208
-
209
-
210
-
211
-
212
-
213
-
214
-
215
-
216
-
217
-
218
-
219
-
220
-
221
-
222
-
223
-
224
-
225
-
226
-
227
-
228
 |
 |

Defend the core franchise against increasing competition
The Company defended its core franchise through bundling, adding 23,000 net subscribers to its Custom
ConnectionsSM “Super Bundle” which offers local, long distance, wireless, DSL, and the Company’s value-added
service package, Custom Connections®, on a single bill at a price lower than the amount the customer would pay
for all of the services individually. The Company finished the year with approximately 173,000 Super Bundle
subscribers, 15% more than at the end of 2005. Total access lines declined by 5% versus 2005, in line with
Company expectations given wireless substitution and other competitive factors. The Company believes that its
Super Bundle customers are less likely to disconnect existing services and change services to a competitor.
Reduce indebtedness
The Company’s total indebtedness was $2,073.2 million at December 31, 2006 compared to $2,084.7
million at December 31, 2005. Additionally, the Company’s cash increased from $25.7 million at December 31,
2005 to $79.4 million at December 31, 2006. The Company expects that a portion of this incremental cash will
be used during 2007 to reduce indebtedness.
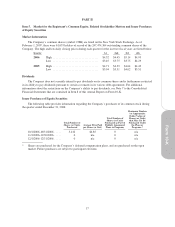
Results of Operations
Consolidated Overview
The financial results for 2006, 2005, and 2004 referred to in this discussion should be read in conjunction
with the Consolidated Statements of Operations and Note 15 to the Consolidated Financial Statements.
2006 Compared to 2005
Consolidated revenue totaled $1,270.1 million in 2006, an increase of $60.5 million, compared to 2005. The
increase was primarily due to the following:
•$43.9 million increased revenues in the Technology Solutions segment primarily due to increased
Telecom and IT equipment sales;
•$24.5 million higher revenues in the Wireless segment due to an increase in postpaid service revenue from
additional subscribers and increased data revenue; and
•$8.3 million lower revenues in the Local segment due to access line loss, partially offset by higher data
and DSL revenues.
Operating income for 2006 was $312.5 million, an increase of $53.7 million compared to 2005. The
increase was primarily due to the following:
•$71.9 million increase in Wireless operating income due to impairment charges of $42.3 million incurred
in 2005 associated with the retirement of certain Time Division Multiple Access (“TDMA”) assets and
decreased depreciation expense of $32.5 million in 2006 primarily associated with the replaced TDMA
network assets;
•$10.1 million decrease in Local operating income due to lower revenue; and
•$7.8 million increase in corporate costs mainly related to the $6.3 million settlement of the Company’s
shareholder litigation in the first quarter of 2006 and increased business development costs.
The minority interest caption relates primarily to the 19.9% minority interest of Cingular Wireless
Corporation PCS, LLC (“Cingular”) in the net income of CBW until the Company’s acquisition of this minority
interest on February 14, 2006. No further minority interest expense was recorded on CBW after February 14,
2006, because CBW is now wholly owned by the Company. The 2005 TDMA impairment charge noted above
gave rise to CBW losses in 2005, and the minority interest income of $11.0 million represents Cingular’s portion
of the losses.
Interest expense decreased to $162.1 million for 2006 compared to $184.4 million in 2005. This decrease is
primarily a result of the Company’s refinancing activities in 2005, which replaced high interest debt for debt with
lower interest rates, partially offset by higher short-term interest rates.
The loss on extinguishment of debt of $99.8 million for 2005 was comprised of a $91.9 million loss related
to the repurchase of the 16% Notes and $7.9 million associated with the repayment of previously existing credit
facilities. See Note 7 to the Consolidated Financial Statements for further details.
21