Cincinnati Bell 2006 Annual Report Download - page 191
Download and view the complete annual report
Please find page 191 of the 2006 Cincinnati Bell annual report below. You can navigate through the pages in the report by either clicking on the pages listed below, or by using the keyword search tool below to find specific information within the annual report.-
 1
1 -
2
-
3
-
4
-
5
-
6
-
7
-
8
-
9
-
10
-
11
-
12
-
13
-
14
-
15
-
16
-
17
-
18
-
19
-
20
-
21
-
22
-
23
-
24
-
25
-
26
-
27
-
28
-
29
-
30
-
31
-
32
-
33
-
34
-
35
-
36
-
37
-
38
-
39
-
40
-
41
-
42
-
43
-
44
-
45
-
46
-
47
-
48
-
49
-
50
-
51
-
52
-
53
-
54
-
55
-
56
-
57
-
58
-
59
-
60
-
61
-
62
-
63
-
64
-
65
-
66
-
67
-
68
-
69
-
70
-
71
-
72
-
73
-
74
-
75
-
76
-
77
-
78
-
79
-
80
-
81
-
82
-
83
-
84
-
85
-
86
-
87
-
88
-
89
-
90
-
91
-
92
-
93
-
94
-
95
-
96
-
97
-
98
-
99
-
100
-
101
-
102
-
103
-
104
-
105
-
106
-
107
-
108
-
109
-
110
-
111
-
112
-
113
-
114
-
115
-
116
-
117
-
118
-
119
-
120
-
121
-
122
-
123
-
124
-
125
-
126
-
127
-
128
-
129
-
130
-
131
-
132
-
133
-
134
-
135
-
136
-
137
-
138
-
139
-
140
-
141
-
142
-
143
-
144
-
145
-
146
-
147
-
148
-
149
-
150
-
151
-
152
-
153
-
154
-
155
-
156
-
157
-
158
-
159
-
160
-
161
-
162
-
163
-
164
-
165
-
166
-
167
-
168
-
169
-
170
-
171
-
172
-
173
-
174
-
175
-
176
-
177
-
178
-
179
-
180
-
 181
181 -
 182
182 -
 183
183 -
 184
184 -
 185
185 -
 186
186 -
 187
187 -
 188
188 -
 189
189 -
 190
190 -
 191
191 -
 192
192 -
 193
193 -
 194
194 -
 195
195 -
 196
196 -
 197
197 -
 198
198 -
 199
199 -
 200
200 -
 201
201 -
202
-
203
-
204
-
205
-
206
-
207
-
208
-
209
-
210
-
211
-
212
-
213
-
214
-
215
-
216
-
217
-
218
-
219
-
220
-
221
-
222
-
223
-
224
-
225
-
226
-
227
-
228
 |
 |

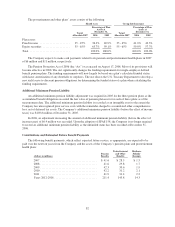
The amounts recognized in the Consolidated Balance Sheets consist of:
Pension Benefits
Postretirement and
Other Benefits
December 31, December 31,
(dollars in millions) 2006 2005 2006 2005
Accrued payroll and benefits (current liability) ........................ $ (6.1) $ (2.2) $ (9.3) $ (8.4)
Accrued pension and postretirement benefits (noncurrent liability) ........ (52.1) (56.5) (303.3) (99.9)
Intangible assets ................................................ — 25.5 — —
As of December 31, 2006 and 2005, the Company’s accumulated benefit obligation (“ABO”) related to its
pension plans was $501.9 million and $499.1 million, respectively.
Amounts recognized in “Accumulated other comprehensive loss” on the Consolidated Balance Sheets
consisted of the following:
Pension Benefits
Postretirement and
Other Benefits
December 31, December 31,
(dollars in millions) 2006 2005 2006 2005
Transition obligation .................................... $ — $ — $ (25.3) $ —
Net prior service cost .................................... (22.2) — (73.1) —
Actuarial net loss ....................................... (74.7) (78.3) (79.8) —
(96.9) (78.3) (178.2) —
Income tax effect ....................................... 35.4 28.7 65.2 —
$(61.5) $(49.6) $(113.0) —
The following amounts currently included in “Accumulated other comprehensive loss” are expected to be
recognized in 2007 as a component of net periodic pension and postretirement cost:
(dollars in millions) Pension Benefits
Postretirement and
Other Benefits
Transition obligation ........................... $— $4.2
Prior service cost .............................. 3.2 7.7
Actuarial loss ................................. 2.8 2.8
Plan Assets and Investment Policies and Strategies
The primary investment objective for the trusts holding the assets of the pension and postretirement plans is
preservation of capital with a reasonable amount of long-term growth and income without undue exposure to
risk. This is provided by a balanced strategy using fixed income and equities.
The pension plans’ assets consist of the following:
Target
Allocation
2007
Percentage of Plan
Assets at
December 31,
2006 2005
Plan assets: .....................................
Fixed income ................................... 20-38% 30.0% 30.4%
Equity securities * ............................... 55-65% 59.9% 60.1%
Real estate ..................................... 8-12% 10.1% 9.5%
Total .......................................... 100.0% 100.0%
* Pension plan assets include $6.4 million and $4.9 million in Company common stock at
December 31, 2006 and 2005, respectively.
81