Cincinnati Bell 2006 Annual Report Download - page 206
Download and view the complete annual report
Please find page 206 of the 2006 Cincinnati Bell annual report below. You can navigate through the pages in the report by either clicking on the pages listed below, or by using the keyword search tool below to find specific information within the annual report.-
 1
1 -
2
-
3
-
4
-
5
-
6
-
7
-
8
-
9
-
10
-
11
-
12
-
13
-
14
-
15
-
16
-
17
-
18
-
19
-
20
-
21
-
22
-
23
-
24
-
25
-
26
-
27
-
28
-
29
-
30
-
31
-
32
-
33
-
34
-
35
-
36
-
37
-
38
-
39
-
40
-
41
-
42
-
43
-
44
-
45
-
46
-
47
-
48
-
49
-
50
-
51
-
52
-
53
-
54
-
55
-
56
-
57
-
58
-
59
-
60
-
61
-
62
-
63
-
64
-
65
-
66
-
67
-
68
-
69
-
70
-
71
-
72
-
73
-
74
-
75
-
76
-
77
-
78
-
79
-
80
-
81
-
82
-
83
-
84
-
85
-
86
-
87
-
88
-
89
-
90
-
91
-
92
-
93
-
94
-
95
-
96
-
97
-
98
-
99
-
100
-
101
-
102
-
103
-
104
-
105
-
106
-
107
-
108
-
109
-
110
-
111
-
112
-
113
-
114
-
115
-
116
-
117
-
118
-
119
-
120
-
121
-
122
-
123
-
124
-
125
-
126
-
127
-
128
-
129
-
130
-
131
-
132
-
133
-
134
-
135
-
136
-
137
-
138
-
139
-
140
-
141
-
142
-
143
-
144
-
145
-
146
-
147
-
148
-
149
-
150
-
151
-
152
-
153
-
154
-
155
-
156
-
157
-
158
-
159
-
160
-
161
-
162
-
163
-
164
-
165
-
166
-
167
-
168
-
169
-
170
-
171
-
172
-
173
-
174
-
175
-
176
-
177
-
178
-
179
-
180
-
181
-
182
-
183
-
184
-
185
-
186
-
187
-
188
-
189
-
190
-
191
-
192
-
193
-
194
-
195
-
 196
196 -
 197
197 -
 198
198 -
 199
199 -
 200
200 -
 201
201 -
 202
202 -
 203
203 -
 204
204 -
 205
205 -
 206
206 -
 207
207 -
 208
208 -
 209
209 -
 210
210 -
 211
211 -
 212
212 -
 213
213 -
 214
214 -
 215
215 -
 216
216 -
217
-
218
-
219
-
220
-
221
-
222
-
223
-
224
-
225
-
226
-
227
-
228
 |
 |

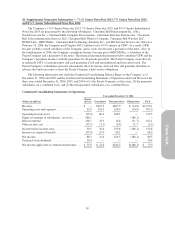
Condensed Consolidating Balance Sheets
As of December 31, 2006
(dollars in millions)
Parent
(Guarantor) CBT
Other
(Non-guarantors) Eliminations Total
Cash and cash equivalents .................. $ 75.9 $ 1.5 $ 2.0 $ — $ 79.4
Receivables, net .......................... 0.3 71.0 90.6 — 161.9
Other current assets ....................... 13.9 36.2 73.2 (17.2) 106.1
Total current assets ...................... 90.1 108.7 165.8 (17.2) 347.4
Property, plant and equipment, net ........... 0.1 589.7 229.0 — 818.8
Goodwill and other intangibles, net ........... — — 166.2 — 166.2
Investments in and advances to subsidiaries .... 1,047.7 — — (1,047.7) —
Other noncurrent assets .................... 365.1 12.0 349.8 (45.5) 681.4
Total assets ........................... $1,503.0 $710.4 $910.8 $(1,110.4) $2,013.8
Current portion of long-term debt ............ $ 4.0 $ 0.9 $ 2.4 $ — $ 7.3
Accounts payable ......................... 0.5 32.7 40.9 — 74.1
Other current liabilities .................... 96.7 92.1 49.0 (0.3) 237.5
Total current liabilities ................... 101.2 125.7 92.3 (0.3) 318.9
Long-term debt, less current portion .......... 1,815.6 236.2 14.1 — 2,065.9
Other noncurrent liabilities ................. 377.8 65.0 40.2 (62.4) 420.6
Intercompany payables .................... — 37.3 432.5 (469.8) —
Total liabilities ......................... 2,294.6 464.2 579.1 (532.5) 2,805.4
Shareowners’ equity (deficit) ................ (791.6) 246.2 331.7 (577.9) (791.6)
Total liabilities and shareowners’ equity
(deficit) ............................ $1,503.0 $710.4 $910.8 $(1,110.4) $2,013.8
As of December 31, 2005
Parent
(Guarantor) CBT
Other
(Non-guarantors) Eliminations Total
Cash and cash equivalents .................. $ 23.9 $ 1.3 $ 0.5 $ — $ 25.7
Receivables, net .......................... 2.2 75.2 83.5 — 160.9
Other current assets ....................... 12.3 29.4 85.5 (20.3) 106.9
Total current assets ...................... 38.4 105.9 169.5 (20.3) 293.5
Property, plant and equipment, net ........... 0.1 603.0 197.3 — 800.4
Goodwill and other intangibles, net ........... 25.5 — 76.7 — 102.2
Investments in and advances to subsidiaries .... 996.6 — — (996.6) —
Other noncurrent assets .................... 296.1 12.5 415.4 (56.8) 667.2
Total assets ........................... $1,356.7 $721.4 $858.9 $(1,073.7) $1,863.3
Current portion of long-term debt ............ $ 4.0 $ 2.5 $ 4.8 $ — $ 11.3
Accounts payable ......................... 0.2 36.9 32.7 — 69.8
Other current liabilities .................... 88.2 66.7 42.9 (1.4) 196.4
Total current liabilities ................... 92.4 106.1 80.4 (1.4) 277.5
Long-term debt, less current portion .......... 1,826.3 237.1 10.0 — 2,073.4
Other noncurrent liabilities ................. 175.7 80.9 41.0 (75.7) 221.9
Intercompany payables .................... — 31.7 470.5 (502.2) —
Total liabilities ......................... 2,094.4 455.8 601.9 (579.3) 2,572.8
Minority interest .......................... — — 28.2 — 28.2
Shareowners’ equity (deficit) ................ (737.7) 265.6 228.8 (494.4) (737.7)
Total liabilities and shareowners’ equity
(deficit) ............................ $1,356.7 $721.4 $858.9 $(1,073.7) $1,863.3
96