Cincinnati Bell 2006 Annual Report Download - page 52
Download and view the complete annual report
Please find page 52 of the 2006 Cincinnati Bell annual report below. You can navigate through the pages in the report by either clicking on the pages listed below, or by using the keyword search tool below to find specific information within the annual report.-
 1
1 -
2
-
3
-
4
-
5
-
6
-
7
-
8
-
9
-
10
-
11
-
12
-
13
-
14
-
15
-
16
-
17
-
18
-
19
-
20
-
21
-
22
-
23
-
24
-
25
-
26
-
27
-
28
-
29
-
30
-
31
-
32
-
33
-
34
-
35
-
36
-
37
-
38
-
39
-
40
-
41
-
 42
42 -
 43
43 -
 44
44 -
 45
45 -
 46
46 -
 47
47 -
 48
48 -
 49
49 -
 50
50 -
 51
51 -
 52
52 -
 53
53 -
 54
54 -
 55
55 -
 56
56 -
 57
57 -
 58
58 -
 59
59 -
 60
60 -
 61
61 -
 62
62 -
63
-
64
-
65
-
66
-
67
-
68
-
69
-
70
-
71
-
72
-
73
-
74
-
75
-
76
-
77
-
78
-
79
-
80
-
81
-
82
-
83
-
84
-
85
-
86
-
87
-
88
-
89
-
90
-
91
-
92
-
93
-
94
-
95
-
96
-
97
-
98
-
99
-
100
-
101
-
102
-
103
-
104
-
105
-
106
-
107
-
108
-
109
-
110
-
111
-
112
-
113
-
114
-
115
-
116
-
117
-
118
-
119
-
120
-
121
-
122
-
123
-
124
-
125
-
126
-
127
-
128
-
129
-
130
-
131
-
132
-
133
-
134
-
135
-
136
-
137
-
138
-
139
-
140
-
141
-
142
-
143
-
144
-
145
-
146
-
147
-
148
-
149
-
150
-
151
-
152
-
153
-
154
-
155
-
156
-
157
-
158
-
159
-
160
-
161
-
162
-
163
-
164
-
165
-
166
-
167
-
168
-
169
-
170
-
171
-
172
-
173
-
174
-
175
-
176
-
177
-
178
-
179
-
180
-
181
-
182
-
183
-
184
-
185
-
186
-
187
-
188
-
189
-
190
-
191
-
192
-
193
-
194
-
195
-
196
-
197
-
198
-
199
-
200
-
201
-
202
-
203
-
204
-
205
-
206
-
207
-
208
-
209
-
210
-
211
-
212
-
213
-
214
-
215
-
216
-
217
-
218
-
219
-
220
-
221
-
222
-
223
-
224
-
225
-
226
-
227
-
228
 |
 |

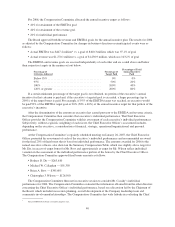
For 2006, the Compensation Committee allocated the annual incentive targets as follows:
•40% for attainment of the EBITDA goal
•40% for attainment of the revenue goal
•20% for individual performance
The Board approved both the revenue and EBITDA goals for the annual incentive plan. The results for 2006
as adjusted by the Compensation Committee for changes in business direction or unanticipated events were as
follows:
•Actual EBITDA was $447.2 million* vs. a goal of $460.3 million, which was 97.1% of goal
•Actual revenue was $1,270.1 million vs. a goal of $1,230.9 million, which was 103.2% of goal
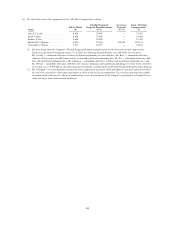
The EBITDA and revenue goals are assessed independently of each other and are scaled above and below
their respective targets in the manner set out below.
Percentage of
Criterion Achieved
Percentage of
Target Paid
Percentage of Total
Annual Incentive
Paid
Below 95% ..................................... 0% 0%
95% .......................................... 50% 20%
100% ......................................... 100% 40%
120% or greater ................................. 200% 80%
If a certain minimum percentage of the target goal is not obtained, no portion of the executive’s annual
incentive for that criterion is paid and, if the executive’s targeted goal is exceeded, a larger percentage (up to
200%) of the target bonus is paid. For example, if 95% of the EBITDA target was reached, an executive would
be paid 50% of the EBITDA target goal or 20% (50% x 40%) of the annual incentive target for that portion of the
executive’s incentive.
After the determination of the amount an executive has earned pursuant to the EBITDA and revenue criteria,
the Compensation Committee then considers that executive’s individual performance. The Chief Executive
Officer provides the Compensation Committee with his assessment of each executive’s individual performances.
Subjectively, without a specific weighting of each factor, the Chief Executive Officer’s assessment includes,
depending on the executive, a consideration of financial, strategic, operational/organizational and personal
performance.
At the Compensation Committee’s regularly scheduled meeting on January 26, 2007, the Chief Executive
Officer presented his assessment of each of the executive’s individual performance and recommended an award
for the final 20% of their bonus that is based on individual performance. The amounts awarded for 2006 to the
named executive officers, also shown in the Summary Compensation Table, which was slightly above target for
Mr. Dir, in excess of target bonus for Mr. Ross and approximately at target for Mr. Wilson reflect individual
variation in the assessment of the individual performance portion of the bonus by the Chief Executive Officer.
The Compensation Committee approved final bonus amounts as follows:
•Rodney D. Dir — $265,610
•Michael W. Callaghan — $91,350
•Brian A. Ross — $345,695
•Christopher J. Wilson — $126,500
The Compensation Committee then met in executive session to consider Mr. Cassidy’s individual
performance for 2006. The Compensation Committee evaluated the information obtained from the other directors
concerning the Chief Executive Officer’s individual performance, based on a discussion led by the Chairman of
the Board, which included succession planning, overall development of the Company leadership team and
community involvement/relationships. The Compensation Committee has wide latitude in evaluating the Chief
*Adjusted EBITDA for bonus calculation purposes only.
40