Cincinnati Bell 2006 Annual Report Download - page 202
Download and view the complete annual report
Please find page 202 of the 2006 Cincinnati Bell annual report below. You can navigate through the pages in the report by either clicking on the pages listed below, or by using the keyword search tool below to find specific information within the annual report.-
 1
1 -
2
-
3
-
4
-
5
-
6
-
7
-
8
-
9
-
10
-
11
-
12
-
13
-
14
-
15
-
16
-
17
-
18
-
19
-
20
-
21
-
22
-
23
-
24
-
25
-
26
-
27
-
28
-
29
-
30
-
31
-
32
-
33
-
34
-
35
-
36
-
37
-
38
-
39
-
40
-
41
-
42
-
43
-
44
-
45
-
46
-
47
-
48
-
49
-
50
-
51
-
52
-
53
-
54
-
55
-
56
-
57
-
58
-
59
-
60
-
61
-
62
-
63
-
64
-
65
-
66
-
67
-
68
-
69
-
70
-
71
-
72
-
73
-
74
-
75
-
76
-
77
-
78
-
79
-
80
-
81
-
82
-
83
-
84
-
85
-
86
-
87
-
88
-
89
-
90
-
91
-
92
-
93
-
94
-
95
-
96
-
97
-
98
-
99
-
100
-
101
-
102
-
103
-
104
-
105
-
106
-
107
-
108
-
109
-
110
-
111
-
112
-
113
-
114
-
115
-
116
-
117
-
118
-
119
-
120
-
121
-
122
-
123
-
124
-
125
-
126
-
127
-
128
-
129
-
130
-
131
-
132
-
133
-
134
-
135
-
136
-
137
-
138
-
139
-
140
-
141
-
142
-
143
-
144
-
145
-
146
-
147
-
148
-
149
-
150
-
151
-
152
-
153
-
154
-
155
-
156
-
157
-
158
-
159
-
160
-
161
-
162
-
163
-
164
-
165
-
166
-
167
-
168
-
169
-
170
-
171
-
172
-
173
-
174
-
175
-
176
-
177
-
178
-
179
-
180
-
181
-
182
-
183
-
184
-
185
-
186
-
187
-
188
-
189
-
190
-
191
-
 192
192 -
 193
193 -
 194
194 -
 195
195 -
 196
196 -
 197
197 -
 198
198 -
 199
199 -
 200
200 -
 201
201 -
 202
202 -
 203
203 -
 204
204 -
 205
205 -
 206
206 -
 207
207 -
 208
208 -
 209
209 -
 210
210 -
 211
211 -
 212
212 -
213
-
214
-
215
-
216
-
217
-
218
-
219
-
220
-
221
-
222
-
223
-
224
-
225
-
226
-
227
-
228
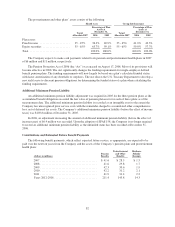
 |
 |

restructuring reserves for termination of contractual obligations, proceeds received from the sale of assets
previously written off, and gain on sale of broadband assets of $3.7 million due to the expiration of certain
indemnities to the buyer.
In the first quarter of 2006, the Company recorded a charge of $6.3 million to the Corporate segment related
to the settlement of the Company’s shareholder litigation. In 2005, “Asset impairments and other charges” in the
Consolidated Statements of Operations of $41.7 million is composed of the Wireless TDMA asset impairment
charge of $42.3 million (refer to Note 4), partially offset by gains on sale of assets previously written off in the
Broadband segment. In 2004, “Asset impairments and other charges” of $3.2 million is composed of Wireless
charges of $5.9 million on certain assets and intangibles, partially offset by $1.5 million of gains on sale of assets
previously written off in the Broadband segment and the gain on sale of out-of-territory assets in the Technology
Solutions segment.
Certain corporate administrative expenses have been allocated to segments based upon the nature of the
expense and the relative size of the segment. The Company’s business segment information is as follows:
Year Ended December 31,
(dollars in millions) 2006 2005 2004
Revenue
Local .............................................. $ 747.3 $ 755.6 $ 761.7
Wireless ............................................ 262.0 237.5 261.7
Technology Solutions ................................. 216.6 172.7 134.7
Other .............................................. 79.0 77.7 78.6
Intersegment ........................................ (34.8) (33.9) (29.6)
Total revenue .......................................... $1,270.1 $1,209.6 $1,207.1
Intersegment revenue
Local .............................................. $ 26.4 $ 25.6 $ 21.1
Wireless ............................................ 2.8 2.7 2.1
Technology Solutions ................................. 1.9 2.6 4.5
Other .............................................. 3.7 3.0 1.9
Total intersegment revenue ............................... $ 34.8 $ 33.9 $ 29.6
Operating income (loss)
Local .............................................. $ 266.0 $ 276.1 $ 279.1
Wireless ............................................ 20.2 (51.7) (1.4)
Technology Solutions ................................. 15.8 13.4 12.7
Other .............................................. 25.8 26.6 18.0
Broadband .......................................... 10.4 12.3 10.7
Corporate and eliminations ............................. (25.7) (17.9) (19.8)
Total operating income .................................. $ 312.5 $ 258.8 $ 299.3
Expenditures for long-lived assets
Local .............................................. $ 89.0 $ 94.3 $ 80.1
Wireless ............................................ 167.7 39.1 32.4
Technology Solutions ................................. 14.7 7.2 15.6
Other .............................................. 3.5 2.4 5.7
Corporate and eliminations ............................. 0.2 — 0.1
Total expenditures for long-lived assets ..................... $ 275.1 $ 143.0 $ 133.9
92