Cincinnati Bell 2006 Annual Report Download - page 129
Download and view the complete annual report
Please find page 129 of the 2006 Cincinnati Bell annual report below. You can navigate through the pages in the report by either clicking on the pages listed below, or by using the keyword search tool below to find specific information within the annual report.-
 1
1 -
2
-
3
-
4
-
5
-
6
-
7
-
8
-
9
-
10
-
11
-
12
-
13
-
14
-
15
-
16
-
17
-
18
-
19
-
20
-
21
-
22
-
23
-
24
-
25
-
26
-
27
-
28
-
29
-
30
-
31
-
32
-
33
-
34
-
35
-
36
-
37
-
38
-
39
-
40
-
41
-
42
-
43
-
44
-
45
-
46
-
47
-
48
-
49
-
50
-
51
-
52
-
53
-
54
-
55
-
56
-
57
-
58
-
59
-
60
-
61
-
62
-
63
-
64
-
65
-
66
-
67
-
68
-
69
-
70
-
71
-
72
-
73
-
74
-
75
-
76
-
77
-
78
-
79
-
80
-
81
-
82
-
83
-
84
-
85
-
86
-
87
-
88
-
89
-
90
-
91
-
92
-
93
-
94
-
95
-
96
-
97
-
98
-
99
-
100
-
101
-
102
-
103
-
104
-
105
-
106
-
107
-
108
-
109
-
110
-
111
-
112
-
113
-
114
-
115
-
116
-
117
-
118
-
 119
119 -
 120
120 -
 121
121 -
 122
122 -
 123
123 -
 124
124 -
 125
125 -
 126
126 -
 127
127 -
 128
128 -
 129
129 -
 130
130 -
 131
131 -
 132
132 -
 133
133 -
 134
134 -
 135
135 -
 136
136 -
 137
137 -
 138
138 -
 139
139 -
140
-
141
-
142
-
143
-
144
-
145
-
146
-
147
-
148
-
149
-
150
-
151
-
152
-
153
-
154
-
155
-
156
-
157
-
158
-
159
-
160
-
161
-
162
-
163
-
164
-
165
-
166
-
167
-
168
-
169
-
170
-
171
-
172
-
173
-
174
-
175
-
176
-
177
-
178
-
179
-
180
-
181
-
182
-
183
-
184
-
185
-
186
-
187
-
188
-
189
-
190
-
191
-
192
-
193
-
194
-
195
-
196
-
197
-
198
-
199
-
200
-
201
-
202
-
203
-
204
-
205
-
206
-
207
-
208
-
209
-
210
-
211
-
212
-
213
-
214
-
215
-
216
-
217
-
218
-
219
-
220
-
221
-
222
-
223
-
224
-
225
-
226
-
227
-
228
 |
 |

Item 6. Selected Financial Data
The Selected Financial Data should be read in conjunction with the Consolidated Financial Statements and
“Management’s Discussion and Analysis of Financial Condition and Results of Operations” included in this document.
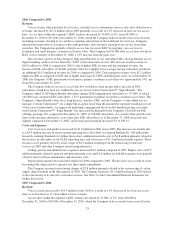
(dollars in millions, except per share amounts) 2006 2005 2004 2003 2002
Operating Data
Revenue ....................................... $1,270.1 $1,209.6 $1,207.1 $1,557.8 $ 2,178.6
Cost of services and products, selling, general, and
administrative, depreciation and amortization ........ 955.5 908.0 896.7 1,204.3 2,034.1
Restructuring, asset impairments and other charges,
shareholder claim settlement (a) .................. 9.7 42.8 14.8 6.2 2,238.0
Gain on sale of broadband assets (b) ................. (7.6) — (3.7) (336.7) —
Operating income (loss) ........................... 312.5 258.8 299.3 684.0 (2,093.5)
Minority interest expense (income) (c) ............... (0.5) (11.0) (0.5) 42.2 57.6
Interest expense (d) .............................. 162.1 184.4 203.3 217.8 164.2
Loss on extinguishment of debt (d) .................. 0.1 99.8 — 17.6 —
Loss on investments ..............................————10.7
Income (loss) from continuing operations before
cumulative effect of change in accounting principle . . . 86.3 (64.5) 64.2 1,246.0 (2,449.2)
Net income (loss) ................................ $ 86.3 $ (64.5) $ 64.2 $1,331.9 $(4,240.3)
Earnings (loss) from continuing operations per common
share
Basic ........................................ $ 0.31 $ (0.30) $ 0.22 $ 5.44 $ (11.27)
Diluted ...................................... $ 0.30 $ (0.30) $ 0.21 $ 5.02 $ (11.27)
Dividends declared per common share ............... $ — $ — $ — $ — $ —
Weighted average common shares outstanding (millions)
Basic ........................................ 246.8 245.9 245.1 226.9 218.4
Diluted ...................................... 253.3 245.9 250.5 253.3 218.4
Financial Position
Property, plant and equipment, net (e) ................ $ 818.8 $ 800.4 $ 857.7 $ 898.8 $ 867.9
Total assets (f) .................................. 2,013.8 1,863.3 1,958.7 2,073.5 1,452.6
Long-term debt (d) ............................... 2,065.9 2,073.4 2,111.1 2,274.5 2,354.7
Total debt (d) ................................... 2,073.2 2,084.7 2,141.2 2,287.8 2,558.4
Total long-term obligations (g) ..................... 2,486.5 2,295.3 2,246.6 2,417.9 3,272.3
Minority interest (c) .............................. — 28.2 39.2 39.7 443.9
Shareowners’ deficit ............................. (791.6) (737.7) (624.5) (679.4) (2,598.8)
Other Data
Cash flow provided by operating activities ............ $ 334.7 $ 322.3 $ 300.7 $ 310.6 $ 192.6
Cash flow provided by (used in) investing activities ..... (260.0) (142.7) (124.3) (42.8) 192.4
Cash flow used in financing activities ................ (21.0) (178.8) (177.5) (286.7) (370.1)
Capital expenditures .............................. (151.3) (143.0) (133.9) (126.4) (175.9)
(a) See Notes 1, 3, 4 and 12 to the Consolidated Financial Statements for discussion related to 2006, 2005, and
2004. An impairment charge of $2.2 billion was recorded in 2002 related to the write-down of assets in the
Broadband segment.
(b) See Note 15 to the Consolidated Financial Statements related to 2006 and 2004. The gain of $336.7 million
recorded in 2003 was a result of substantially selling all of the broadband operating assets.
(c) See Note 10 to the Consolidated Financial Statements. The year 2002 included BRCOM Preferred Stock,
which prior to its exchange in 2003 was classified as minority interest in the Consolidated Financial
Statements.
(d) See Note 7 to the Consolidated Financial Statements.
(e) See Note 4 to the Consolidated Financial Statements for discussion related to 2006, 2005, and 2004.
(f) See Notes 1, 4, 6 and 13 to the Consolidated Financial Statements for discussion related to 2006, 2005, and
2004.
(g) Total long-term obligations comprise long-term debt, accrued pension and postretirement, deferred revenue,
other noncurrent liabilities and the BRCOM Preferred Stock, which prior to its exchange in 2003 was
classified as minority interest in the Consolidated Financial Statements.
19