Cincinnati Bell 2006 Annual Report Download - page 187
Download and view the complete annual report
Please find page 187 of the 2006 Cincinnati Bell annual report below. You can navigate through the pages in the report by either clicking on the pages listed below, or by using the keyword search tool below to find specific information within the annual report.-
 1
1 -
2
-
3
-
4
-
5
-
6
-
7
-
8
-
9
-
10
-
11
-
12
-
13
-
14
-
15
-
16
-
17
-
18
-
19
-
20
-
21
-
22
-
23
-
24
-
25
-
26
-
27
-
28
-
29
-
30
-
31
-
32
-
33
-
34
-
35
-
36
-
37
-
38
-
39
-
40
-
41
-
42
-
43
-
44
-
45
-
46
-
47
-
48
-
49
-
50
-
51
-
52
-
53
-
54
-
55
-
56
-
57
-
58
-
59
-
60
-
61
-
62
-
63
-
64
-
65
-
66
-
67
-
68
-
69
-
70
-
71
-
72
-
73
-
74
-
75
-
76
-
77
-
78
-
79
-
80
-
81
-
82
-
83
-
84
-
85
-
86
-
87
-
88
-
89
-
90
-
91
-
92
-
93
-
94
-
95
-
96
-
97
-
98
-
99
-
100
-
101
-
102
-
103
-
104
-
105
-
106
-
107
-
108
-
109
-
110
-
111
-
112
-
113
-
114
-
115
-
116
-
117
-
118
-
119
-
120
-
121
-
122
-
123
-
124
-
125
-
126
-
127
-
128
-
129
-
130
-
131
-
132
-
133
-
134
-
135
-
136
-
137
-
138
-
139
-
140
-
141
-
142
-
143
-
144
-
145
-
146
-
147
-
148
-
149
-
150
-
151
-
152
-
153
-
154
-
155
-
156
-
157
-
158
-
159
-
160
-
161
-
162
-
163
-
164
-
165
-
166
-
167
-
168
-
169
-
170
-
171
-
172
-
173
-
174
-
175
-
176
-
 177
177 -
 178
178 -
 179
179 -
 180
180 -
 181
181 -
 182
182 -
 183
183 -
 184
184 -
 185
185 -
 186
186 -
 187
187 -
 188
188 -
 189
189 -
 190
190 -
 191
191 -
 192
192 -
 193
193 -
 194
194 -
 195
195 -
 196
196 -
 197
197 -
198
-
199
-
200
-
201
-
202
-
203
-
204
-
205
-
206
-
207
-
208
-
209
-
210
-
211
-
212
-
213
-
214
-
215
-
216
-
217
-
218
-
219
-
220
-
221
-
222
-
223
-
224
-
225
-
226
-
227
-
228
 |
 |

recorded in property, plant and equipment and an offsetting amount recorded as a liability discounted to the
present value. The Company had $23.2 million in total indebtedness relating to capitalized leases as of
December 31, 2006, $20.7 million of which was considered long-term. The underlying leased assets generally
secure the capital lease obligations. For 2006, 2005 and 2004, the Company recorded $1.3 million, $1.3 million
and $1.6 million, respectively, of interest expense related to capital lease obligations.
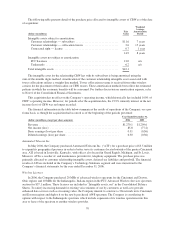
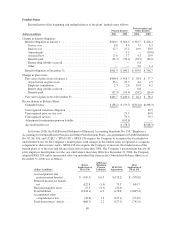
Debt Maturity Schedule
As of December 31, 2006, the following table summarizes the Company’s annual principal maturities of
debt and capital leases for the five years subsequent to December 31, 2006, and thereafter:
(dollars in millions) Debt
Capital
Leases
Total
Debt
Year ended December 31,
2007 ........................................... $ 4.8 $ 2.5 $ 7.3
2008 ........................................... 4.0 2.3 6.3
2009 ........................................... 4.0 2.5 6.5
2010 ........................................... 4.0 6.9 10.9
2011 ........................................... 97.0 2.3 99.3
Thereafter ...................................... 1,948.9 6.7 1,955.6
2,062.7 23.2 2,085.9
Interest rate swaps ................................ (13.5) — (13.5)
Net unamortized premiums ......................... 0.8 — 0.8
Total debt .................................... $2,050.0 $23.2 $2,073.2
For capital leases, total lease payments including interest are $4.3 million for 2007, $3.9 million for 2008,
$3.9 million for 2009, $8.2 million for 2010, $2.9 million for 2011, and $7.9 million thereafter.
Deferred Financing Costs
Deferred financing costs are costs incurred in connection with obtaining long-term financing. These costs
are amortized as interest expense over the terms of the related debt agreements. As of December 31, 2006 and
2005, deferred financing costs totaled $34.0 million and $39.2 million, respectively. The related expense,
included in “Interest expense” in the Consolidated Statements of Operations amounted to $5.1 million, $7.1
million, and $12.5 million during 2006, 2005 and 2004, respectively. In 2006, the Company wrote-off deferred
financing costs of $0.1 million related to the $3.1 million debt prepayment for the 7
1
⁄
4
% Notes due 2013. In
2005, the Company wrote-off deferred financing costs of $7.9 million and $9.1 million related to the
extinguishment of the previous credit facility and the 16% Notes, respectively. The write-offs of deferred
financing costs were included in the Consolidated Statements of Operations under the caption “Loss on
extinguishment of debt.”
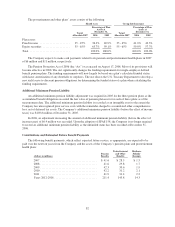
Fair Value
The carrying amounts of debt, excluding capital leases and net unamortized premiums, at December 31,
2006 and 2005 were $2,049.2 million and $2,061.5 million, respectively. The estimated fair values at
December 31, 2006 and 2005 were $2,104 million and $2,059 million, respectively. These fair values were
estimated based on the year-end closing market prices of the Company’s debt and of similar liabilities.
8. Financial Instruments
The Company is exposed to the impact of interest rate fluctuations on its indebtedness. The Company
attempts to maintain an optimal balance of fixed rate and variable rate indebtedness in order to attain low overall
borrowing costs while mitigating exposure to interest rate fluctuations. The Company employs derivative
financial instruments to manage its balance of fixed rate and variable rate indebtedness. In particular, the
Company currently has outstanding interest rate swap agreements in which the Company exchanges fixed rate
interest payments for variable rate interest payments on $450 million notional amounts. Including the impact of
77