Cincinnati Bell 2006 Annual Report Download - page 135
Download and view the complete annual report
Please find page 135 of the 2006 Cincinnati Bell annual report below. You can navigate through the pages in the report by either clicking on the pages listed below, or by using the keyword search tool below to find specific information within the annual report.-
 1
1 -
2
-
3
-
4
-
5
-
6
-
7
-
8
-
9
-
10
-
11
-
12
-
13
-
14
-
15
-
16
-
17
-
18
-
19
-
20
-
21
-
22
-
23
-
24
-
25
-
26
-
27
-
28
-
29
-
30
-
31
-
32
-
33
-
34
-
35
-
36
-
37
-
38
-
39
-
40
-
41
-
42
-
43
-
44
-
45
-
46
-
47
-
48
-
49
-
50
-
51
-
52
-
53
-
54
-
55
-
56
-
57
-
58
-
59
-
60
-
61
-
62
-
63
-
64
-
65
-
66
-
67
-
68
-
69
-
70
-
71
-
72
-
73
-
74
-
75
-
76
-
77
-
78
-
79
-
80
-
81
-
82
-
83
-
84
-
85
-
86
-
87
-
88
-
89
-
90
-
91
-
92
-
93
-
94
-
95
-
96
-
97
-
98
-
99
-
100
-
101
-
102
-
103
-
104
-
105
-
106
-
107
-
108
-
109
-
110
-
111
-
112
-
113
-
114
-
115
-
116
-
117
-
118
-
119
-
120
-
121
-
122
-
123
-
124
-
 125
125 -
 126
126 -
 127
127 -
 128
128 -
 129
129 -
 130
130 -
 131
131 -
 132
132 -
 133
133 -
 134
134 -
 135
135 -
 136
136 -
 137
137 -
 138
138 -
 139
139 -
 140
140 -
 141
141 -
 142
142 -
 143
143 -
 144
144 -
 145
145 -
146
-
147
-
148
-
149
-
150
-
151
-
152
-
153
-
154
-
155
-
156
-
157
-
158
-
159
-
160
-
161
-
162
-
163
-
164
-
165
-
166
-
167
-
168
-
169
-
170
-
171
-
172
-
173
-
174
-
175
-
176
-
177
-
178
-
179
-
180
-
181
-
182
-
183
-
184
-
185
-
186
-
187
-
188
-
189
-
190
-
191
-
192
-
193
-
194
-
195
-
196
-
197
-
198
-
199
-
200
-
201
-
202
-
203
-
204
-
205
-
206
-
207
-
208
-
209
-
210
-
211
-
212
-
213
-
214
-
215
-
216
-
217
-
218
-
219
-
220
-
221
-
222
-
223
-
224
-
225
-
226
-
227
-
228
 |
 |

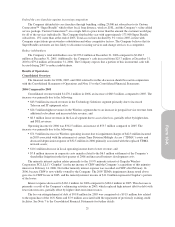
including customers electing to use wireless communication in lieu of the traditional local service, Company-
initiated disconnections of customers with credit problems, and customers electing to use service from other
providers. The Company has partially offset its access line loss in its ILEC by targeting voice services to
residential and small business customers in Dayton, Ohio. The Company had 38,000 total access lines outside its
ILEC service territory at December 31, 2005, a 25% increase from the prior year.
The increase in data revenue of $15.3 million for 2005 as compared to 2004 is due to higher DSL revenue
and data transport revenue. An increase in average DSL subscribers of 32,000, partially offset by a slightly lower
average rate per subscriber, produced an additional $11.1 million in revenue for 2005 as compared to 2004. Also,
data transport revenues were $6.6 million higher in 2005 as compared to 2004. These increases were partially
offset by a decrease of $2.0 million in dial-up internet revenues, attributable to both a decrease in rate and
average subscribers, as dial-up customers migrate to DSL. As of December 31, 2005, the Company’s DSL
penetration of in-territory primary consumer access lines was 26%, up from 20% at December 31, 2004.
The Company added 27,000 Super Bundle subscribers during 2005, bringing total subscribers to 150,000, of
which 143,000 were consumer ILEC subscribers, a 26% penetration of access lines. An aggressive marketing
campaign and the favorable bundled pricing associated with Custom ConnectionsSM “Super Bundle” has
increased the demand for the Company’s ZoomTown DSL offering, which added 32,000 subscribers in 2005,
growing 24% compared to December 31, 2004, to 163,000 subscribers. As a result of this growth, total lines to
the customer (defined as access lines plus DSL subscribers) as of December 31, 2005 decreased only slightly
compared to December 31, 2004, and revenue per household increased 3% to $48.73.
Costs and Expenses
Cost of services and products increased by $15.9 million for 2005 versus 2004 primarily due to the
following:
•$15.5 million increase for higher pension and postretirement expense;
•$2.7 million increase in employee health costs;
•$11.9 million decrease in state gross receipts tax and property taxes. Beginning with the third quarter of
2004 through the second quarter of 2005, CBT was not subject to Ohio franchise taxes based on gross
receipts, but instead was subject to state and local income tax;
•$5.4 million increase in network and other costs related to the out-of-territory expansion of the Company’s
CLEC operations;
•$1.3 million increase in right-to-use fees for webhosting services and product costs to support additional
DSL subscribers; and
•remaining cost increases are primarily associated with increases in fuel and energy costs, higher
regulatory fees, and software development.
Selling, general and administrative expenses decreased $1.1 million compared to 2004. Higher costs of
$4.5 million for pension, postretirement and employee medical expenses were more than offset by lower
advertising costs of $2.4 million, lower labor and other employee costs, and lower consulting fees.
Depreciation expense decreased $9.0 million in 2005 compared to 2004. The decreases were primarily due
to changes in depreciation rates in the fourth quarter of 2004 used as a result of updated estimates of the
depreciable assets’ useful lives.
In 2004, the Company initiated a restructuring to improve operating efficiencies and reduce operating
expenses resulting in a charge of $10.4 million. The Company incurred a $1.5 million charge in 2005 related to
the outsourcing of its directory assistance services. See Note 3 to the Consolidated Financial Statements for
further discussion.
25