Cincinnati Bell 2006 Annual Report Download - page 203
Download and view the complete annual report
Please find page 203 of the 2006 Cincinnati Bell annual report below. You can navigate through the pages in the report by either clicking on the pages listed below, or by using the keyword search tool below to find specific information within the annual report.-
 1
1 -
2
-
3
-
4
-
5
-
6
-
7
-
8
-
9
-
10
-
11
-
12
-
13
-
14
-
15
-
16
-
17
-
18
-
19
-
20
-
21
-
22
-
23
-
24
-
25
-
26
-
27
-
28
-
29
-
30
-
31
-
32
-
33
-
34
-
35
-
36
-
37
-
38
-
39
-
40
-
41
-
42
-
43
-
44
-
45
-
46
-
47
-
48
-
49
-
50
-
51
-
52
-
53
-
54
-
55
-
56
-
57
-
58
-
59
-
60
-
61
-
62
-
63
-
64
-
65
-
66
-
67
-
68
-
69
-
70
-
71
-
72
-
73
-
74
-
75
-
76
-
77
-
78
-
79
-
80
-
81
-
82
-
83
-
84
-
85
-
86
-
87
-
88
-
89
-
90
-
91
-
92
-
93
-
94
-
95
-
96
-
97
-
98
-
99
-
100
-
101
-
102
-
103
-
104
-
105
-
106
-
107
-
108
-
109
-
110
-
111
-
112
-
113
-
114
-
115
-
116
-
117
-
118
-
119
-
120
-
121
-
122
-
123
-
124
-
125
-
126
-
127
-
128
-
129
-
130
-
131
-
132
-
133
-
134
-
135
-
136
-
137
-
138
-
139
-
140
-
141
-
142
-
143
-
144
-
145
-
146
-
147
-
148
-
149
-
150
-
151
-
152
-
153
-
154
-
155
-
156
-
157
-
158
-
159
-
160
-
161
-
162
-
163
-
164
-
165
-
166
-
167
-
168
-
169
-
170
-
171
-
172
-
173
-
174
-
175
-
176
-
177
-
178
-
179
-
180
-
181
-
182
-
183
-
184
-
185
-
186
-
187
-
188
-
189
-
190
-
191
-
192
-
 193
193 -
 194
194 -
 195
195 -
 196
196 -
 197
197 -
 198
198 -
 199
199 -
 200
200 -
 201
201 -
 202
202 -
 203
203 -
 204
204 -
 205
205 -
 206
206 -
 207
207 -
 208
208 -
 209
209 -
 210
210 -
 211
211 -
 212
212 -
 213
213 -
214
-
215
-
216
-
217
-
218
-
219
-
220
-
221
-
222
-
223
-
224
-
225
-
226
-
227
-
228
 |
 |

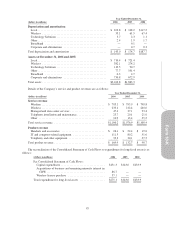
Year Ended December 31,
(dollars in millions) 2006 2005 2004
Depreciation and amortization
Local ................................................ $ 103.8 $ 108.2 $117.2
Wireless ............................................. 33.1 61.5 67.4
Technology Solutions ................................... 3.7 2.3 1.1
Other ................................................ 2.4 1.9 1.7
Broadband ........................................... — 0.1 —
Corporate and eliminations .............................. — 0.7 0.3
Total depreciation and amortization .......................... $ 143.0 $ 174.7 $187.7
Assets (at December 31, 2006 and 2005)
Local ................................................ $ 710.4 $ 721.4
Wireless ............................................. 382.1 274.2
Technology Solutions ................................... 112.5 90.7
Other ................................................ 77.7 101.4
Broadband ........................................... 0.3 2.7
Corporate and eliminations .............................. 730.8 672.9
Total assets ............................................. $2,013.8 $1,863.3
Details of the Company’s service and product revenues are as follows:
Year Ended December 31,
(dollars in millions) 2006 2005 2004
Service revenue
Wireline ............................................ $ 785.1 $ 793.9 $ 798.8
Wireless ............................................ 233.1 212.4 240.0
Managed and data center services ........................ 47.4 37.1 23.4
Telephony installation and maintenance ................... 23.7 20.1 21.0
Other .............................................. 10.9 13.4 25.2
Total service revenue ................................... $1,100.2 $1,076.9 $1,108.4
Product revenue
Handsets and accessories .............................. $ 26.1 $ 22.4 $ 19.6
IT and computer-related equipment ...................... 111.5 80.2 51.6
Telephony and other equipment ......................... 32.3 30.1 27.5
Total product revenue ................................... $ 169.9 $ 132.7 $ 98.7
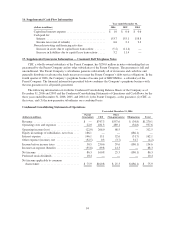
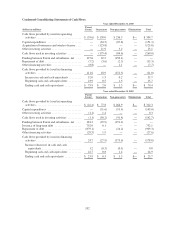
The reconciliation of the Consolidated Statement of Cash Flows to expenditures for long-lived assets is as
follows:
(dollars in millions) 2006 2005 2004
Per Consolidated Statement of Cash Flows:
Capital expenditures ............................... $151.3 $143.0 $133.9
Acquisitions of business and remaining minority interest in
CBW......................................... 86.7 — —
Wireless license purchase .......................... 37.1 — —
Total expenditure for long-lived assets .................. $275.1 $143.0 $133.9
93