Cincinnati Bell 2006 Annual Report Download - page 200
Download and view the complete annual report
Please find page 200 of the 2006 Cincinnati Bell annual report below. You can navigate through the pages in the report by either clicking on the pages listed below, or by using the keyword search tool below to find specific information within the annual report.-
 1
1 -
2
-
3
-
4
-
5
-
6
-
7
-
8
-
9
-
10
-
11
-
12
-
13
-
14
-
15
-
16
-
17
-
18
-
19
-
20
-
21
-
22
-
23
-
24
-
25
-
26
-
27
-
28
-
29
-
30
-
31
-
32
-
33
-
34
-
35
-
36
-
37
-
38
-
39
-
40
-
41
-
42
-
43
-
44
-
45
-
46
-
47
-
48
-
49
-
50
-
51
-
52
-
53
-
54
-
55
-
56
-
57
-
58
-
59
-
60
-
61
-
62
-
63
-
64
-
65
-
66
-
67
-
68
-
69
-
70
-
71
-
72
-
73
-
74
-
75
-
76
-
77
-
78
-
79
-
80
-
81
-
82
-
83
-
84
-
85
-
86
-
87
-
88
-
89
-
90
-
91
-
92
-
93
-
94
-
95
-
96
-
97
-
98
-
99
-
100
-
101
-
102
-
103
-
104
-
105
-
106
-
107
-
108
-
109
-
110
-
111
-
112
-
113
-
114
-
115
-
116
-
117
-
118
-
119
-
120
-
121
-
122
-
123
-
124
-
125
-
126
-
127
-
128
-
129
-
130
-
131
-
132
-
133
-
134
-
135
-
136
-
137
-
138
-
139
-
140
-
141
-
142
-
143
-
144
-
145
-
146
-
147
-
148
-
149
-
150
-
151
-
152
-
153
-
154
-
155
-
156
-
157
-
158
-
159
-
160
-
161
-
162
-
163
-
164
-
165
-
166
-
167
-
168
-
169
-
170
-
171
-
172
-
173
-
174
-
175
-
176
-
177
-
178
-
179
-
180
-
181
-
182
-
183
-
184
-
185
-
186
-
187
-
188
-
189
-
 190
190 -
 191
191 -
 192
192 -
 193
193 -
 194
194 -
 195
195 -
 196
196 -
 197
197 -
 198
198 -
 199
199 -
 200
200 -
 201
201 -
 202
202 -
 203
203 -
 204
204 -
 205
205 -
 206
206 -
 207
207 -
 208
208 -
 209
209 -
 210
210 -
211
-
212
-
213
-
214
-
215
-
216
-
217
-
218
-
219
-
220
-
221
-
222
-
223
-
224
-
225
-
226
-
227
-
228
 |
 |

The Company also immediately vested 1,673,700 options that were granted in December 2005. Restrictions were
placed on the December 2005 option grant, such that the recipient’s right to sell any shares obtained upon
exercise of the options was limited to 28% upon the first anniversary of the grant, and an additional 3% per
month in each of the 24 months thereafter. These selling restrictions do not represent a substantive service
period, and the restrictions lapse in the event that the option holder’s employment with the Company terminates.
As a result of the vesting of all out-of-the-money options and the December 2005 grant, the Company estimated
that the impact on pro forma expense was $3.4 million, net of tax, in 2005. This amount was included in the pro
forma stock based compensation expense as disclosed in Note 1.
The decision to accelerate the vesting of the out-of-the-money options and to fully vest the December 2005
option grant was made primarily to reduce compensation expense that otherwise would have been recorded in
future periods following the Company’s adoption in 2006 of SFAS 123(R). Additionally, the Company believes
this action further enhances management’s focus on shareholder return and is in the best interest of the
Company’s shareholders.
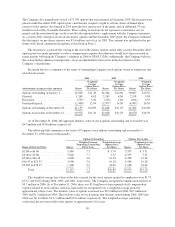
Presented below is a summary of the status of outstanding Company stock options issued to employees and
related transactions:
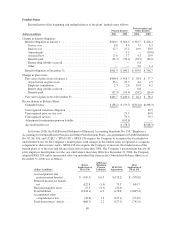
2006 2005 2004
(in thousands, except per share amounts) Shares
Weighted-
Average
Option Prices
Per Share Shares
Weighted-
Average
Option Prices
Per Share Shares
Weighted-
Average
Option Prices
Per Share
Options outstanding at January 1, ....... 22,828 $11.28 24,364 $12.06 30,007 $13.45
Granted ............................ 1,260 4.61 2,163 4.06 2,198 3.98
Exercised .......................... (535) 3.56 (722) 3.48 (854) 3.55
Forfeited/expired .................... (2,400) 12.94 (2,977) 14.38 (6,987) 16.58
Options outstanding at December 31, .... 21,153 $10.89 22,828 $11.28 24,364 $12.06
Options exercisable at December 31, ..... 19,974 $11.26 22,828 $11.28 18,670 $14.30
As of December 31, 2006, the aggregate intrinsic value of stock options outstanding and exercisable was
$4.9 million and $4.8 million, respectively.
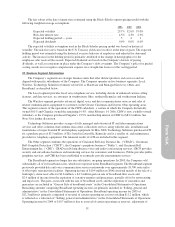
The following table summarizes the status of Company stock options outstanding and exercisable at
December 31, 2006 (shares in thousands):
Options Outstanding Options Exercisable
Range of Exercise Prices Shares
Weighted-Average
Remaining Contractual
Life in Years
Weighted-Average
Option Prices
Per Share Shares
Weighted-Average
Option Prices
Per Share
$1.88 to $4.00 ................ 5,469 7.5 $ 3.70 5,375 $ 3.71
$4.06 to $5.66 ................ 5,420 7.7 5.32 4,335 5.47
$5.68 to $16.18 ............... 4,498 3.0 12.24 4,498 12.24
$16.43 to $23.53 .............. 4,598 2.9 19.18 4,598 19.18
$23.69 to $38.19 .............. 1,168 3.2 32.62 1,168 32.62
Total .................... 21,153 5.3 $10.89 19,974 $11.26
The weighted average fair values at the date of grant for the stock options granted to employees were $1.57,
$1.37, and $1.09 during 2006, 2005, and 2004, respectively. The Company recognized compensation expense of
$0.2 million in 2006. As of December 31, 2006, there was $1.6 million of unrecognized stock compensation
expense related to stock options, which is expected to be recognized over a weighted-average period of
approximately three years. The intrinsic value of options exercised was $0.5 million in 2006, $0.7 million in
2005 and $1.1 million in 2004. The total fair value of stock options that became vested during 2006, 2005 and
2004 was $0.1 million, $13.1 million and $19.6 million, respectively. The weighted-average remaining
contractual life for exercisable stock options is approximately five years.
90