Chevron 2013 Annual Report Download - page 81
Download and view the complete annual report
Please find page 81 of the 2013 Chevron annual report below. You can navigate through the pages in the report by either clicking on the pages listed below, or by using the keyword search tool below to find specific information within the annual report.-
 1
1 -
2
-
3
-
4
-
5
-
6
-
7
-
8
-
9
-
10
-
11
-
12
-
13
-
14
-
15
-
16
-
17
-
18
-
19
-
20
-
21
-
22
-
23
-
24
-
25
-
26
-
27
-
28
-
29
-
30
-
31
-
32
-
33
-
34
-
35
-
36
-
37
-
38
-
39
-
40
-
41
-
42
-
43
-
44
-
45
-
46
-
47
-
48
-
49
-
50
-
51
-
52
-
53
-
54
-
55
-
56
-
57
-
58
-
59
-
60
-
61
-
62
-
63
-
64
-
65
-
66
-
67
-
68
-
69
-
70
-
 71
71 -
 72
72 -
 73
73 -
 74
74 -
 75
75 -
 76
76 -
 77
77 -
 78
78 -
 79
79 -
 80
80 -
 81
81 -
 82
82 -
 83
83 -
 84
84 -
 85
85 -
 86
86 -
 87
87 -
 88
88
 |
 |

Chevron Corporation 2013 Annual Report 79
Table VI Standardized Measure of Discounted Future Net Cash
Flows Related to Proved Oil and Gas Reserves
e standardized measure of discounted future net cash
ows, related to the preceding proved oil and gas reserves, is calcu-
lated in accordance with the requirements of the FASB. Estimated
future cash inows from production are computed by applying
12-month average prices for oil and gas to year-end quantities of
estimated net proved reserves. Future price changes are limited
to those provided by contractual arrangements in existence at the
end of each reporting year. Future development and production
costs are those estimated future expenditures necessary to develop
and produce year-end estimated proved reserves based on year-end
cost indices, assuming continuation of year-end economic condi-
tions, and include estimated costs for asset retirement obligations.
Estimated future income taxes are calculated by applying appro-
priate year-end statutory tax rates. ese rates reect allowable
deductions and tax credits and are applied to estimated future pre-
tax net cash ows, less the tax basis of related assets. Discounted
future net cash ows are calculated using 10 percent midperiod
discount factors. Discounting requires a year-by-year esti-
mate of when future expenditures will be incurred and when
reserves will be produced.
e information provided does not represent manage-
ment’s estimate of the company’s expected future cash ows or
value of proved oil and gas reserves. Estimates of proved-reserve
quantities are imprecise and change over time as new infor-
mation becomes available. Moreover, probable and possible
reserves, which may become proved in the future, are excluded
from the calculations. e valuation prescribed by the FASB
requires assumptions as to the timing and amount of future
development and production costs. e calculations are made
as of December 31 each year and should not be relied upon as
an indication of the company’s future cash ows or value of
its oil and gas reserves. In the following table, “Standardized
Measure Net Cash Flows” refers to the standardized measure
of discounted future net cash ows.
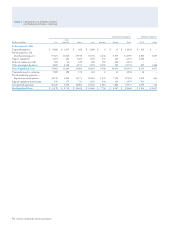
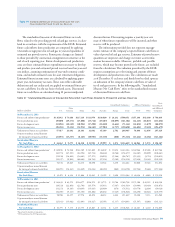
Table VI – Standardized Measure of Discounted Future Net Cash Flows Related to Proved Oil and Gas Reserves
Tota l
Consolidated Companies Aliated Companies Consolidated
Other and Aliated
Millions of dollars U.S. Americas Africa Asia Australia Europe Total
TCO Other Companies
At December 31, 2013
Future cash inows from production1 $ 136,942 $ 73,468 $ 117,119 $ 111,970 $ 130,620 $ 20,232 $ 590,351 $ 157,108 $ 43,380 $ 790,839
Future production costs (39,009) (29,373) (27,800) (35,716) (19,387) (10,099) (161,384) (32,245) (18,027) (211,656)
Future development costs (12,058) (10,149) (10,983) (17,290) (18,220) (2,644) (71,344) (12,852) (3,879) (88,075)
Future income taxes (28,458) (9,454) (53,953) (26,162) (27,904) (4,727) (150,658) (33,603) (9,418) (193,679)
Undiscounted future net cash ows 57,417 24,492 24,383 32,802 65,109 2,762 206,965 78,408 12,056 297,429
10 percent midyear annual discount
for timing of estimated cash ows (23,055) (15,217) (8,165) (10,901) (35,110) (888) (93,336) (41,444) (6,482) (141,262)
Standardized Measure
Net Cash Flows $ 34,362 $ 9,275 $ 16,218 $ 21,901 $ 29,999 $ 1,874 $ 113,629 $ 36,964 $ 5,574 $ 156,167
At December 31, 20122
Future cash inows from production1 $ 139,856 $ 72,548 $ 122,189 $ 121,849 $ 134,009 $ 19,653 $ 610,104 $ 169,966 $ 47,496 $ 827,566
Future production costs (41,773) (27,191) (24,592) (35,713) (18,340) (8,768) (156,377) (32,085) (19,899) (208,361)
Future development costs (11,192) (14,810) (14,601) (17,275) (24,923) (1,946) (84,747) (12,355) (3,710) (100,812)
Future income taxes (32,357) (9,902) (48,683) (30,763) (27,224) (5,589) (154,518) (37,658) (13,363) (205,539)
Undiscounted future net cash ows 54,534 20,645 34,313 38,098 63,522 3,350 214,462 87,868 10,524 312,854
10 percent midyear annual discount
for timing of estimated cash ows (23,055) (14,331) (12,429) (13,033) (40,450) (860) (104,158) (47,534) (5,644) (157,336)
Standardized Measure
Net Cash Flows $ 31,479 $ 6,314 $ 21,884 $ 25,065 $ 23,072 $ 2,490 $ 110,304 $ 40,334 $ 4,880 $ 155,518
At December 31, 2011
Future cash inows from production1 $ 143,633 $ 63,579 $ 124,077 $ 124,972 $ 113,773 $ 19,704 $ 589,738 $ 171,588 $ 42,212 $ 803,538
Future production costs (39,523) (22,856) (22,703) (35,579) (15,411) (7,467) (143,539) (30,904) (19,430) (193,873)
Future development costs (11,272) (9,345) (10,695) (15,035) (29,489) (676) (76,512) (10,778) (2,836) (90,126)
Future income taxes (34,050) (9,121) (53,103) (33,884) (20,661) (7,229) (158,048) (36,698) (10,833) (205,579)
Undiscounted future net cash ows 58,788 22,257 37,576 40,474 48,212 4,332 211,639 93,208 9,113 313,960
10 percent midyear annual discount
for timing of estimated cash ows (25,013) (15,082) (13,801) (14,627) (35,051) (1,117) (104,691) (51,547) (4,883) (161,121)
Standardized Measure
Net Cash Flows $ 33,775 $ 7,175 $ 23,775 $ 25,847 $ 13,161 $ 3,215 $ 106,948 $ 41,661 $ 4,230 $ 152,839
1 Based on 12-month average price.
2 2012 conformed to 2013 presentation.