Chevron 2013 Annual Report Download - page 75
Download and view the complete annual report
Please find page 75 of the 2013 Chevron annual report below. You can navigate through the pages in the report by either clicking on the pages listed below, or by using the keyword search tool below to find specific information within the annual report.-
 1
1 -
2
-
3
-
4
-
5
-
6
-
7
-
8
-
9
-
10
-
11
-
12
-
13
-
14
-
15
-
16
-
17
-
18
-
19
-
20
-
21
-
22
-
23
-
24
-
25
-
26
-
27
-
28
-
29
-
30
-
31
-
32
-
33
-
34
-
35
-
36
-
37
-
38
-
39
-
40
-
41
-
42
-
43
-
44
-
45
-
46
-
47
-
48
-
49
-
50
-
51
-
52
-
53
-
54
-
55
-
56
-
57
-
58
-
59
-
60
-
61
-
62
-
63
-
64
-
 65
65 -
 66
66 -
 67
67 -
 68
68 -
 69
69 -
 70
70 -
 71
71 -
 72
72 -
 73
73 -
 74
74 -
 75
75 -
 76
76 -
 77
77 -
 78
78 -
 79
79 -
 80
80 -
 81
81 -
 82
82 -
 83
83 -
 84
84 -
 85
85 -
86
-
87
-
88
 |
 |

Chevron Corporation 2013 Annual Report 73
Reserves Governance e company has adopted a compre-
hensive reserves and resource classication system modeled
after a system developed and approved by the Society of
Petroleum Engineers, the World Petroleum Congress and
the American Association of Petroleum Geologists. e sys-
tem classies recoverable hydrocarbons into six categories
based on their status at the time of reporting – three deemed
commercial and three potentially recoverable. Within the
commercial classication are proved reserves and two cat-
egories of unproved: probable and possible. e potentially
recoverable categories are also referred to as contingent
resources. For reserves estimates to be classied as proved,
they must meet all SEC and company standards.
Proved oil and gas reserves are the estimated quantities
that geoscience and engineering data demonstrate with rea-
sonable certainty to be economically producible in the future
from known reservoirs under existing economic conditions,
operating methods and government regulations. Net proved
reserves exclude royalties and interests owned by others and
reect contractual arrangements and royalty obligations in
eect at the time of the estimate.
Proved reserves are classied as either developed or unde-
veloped. Proved developed reserves are the quantities expected
to be recovered through existing wells with existing equip-
ment and operating methods.
Due to the inherent uncertainties and the limited nature
of reservoir data, estimates of reserves are subject to change as
additional information becomes available.
Proved reserves are estimated by company asset teams
composed of earth scientists and engineers. As part of the
internal control process related to reserves estimation, the
company maintains a Reserves Advisory Committee (RAC)
that is chaired by the Manager of Corporate Reserves, a cor-
porate department that reports directly to the Vice Chairman
responsible for the company’s worldwide exploration and
production activities. e Manager of Corporate Reserves has
more than 30 years’ experience working in the oil and gas
industry and a Master of Science in Petroleum Engineering
degree from Stanford University. His experience includes
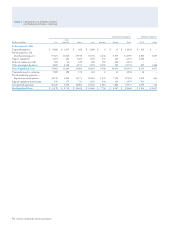
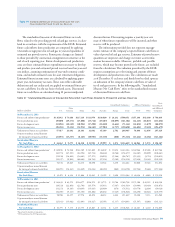
Table V Reserve Quantity Information
Table V Reserve Quantity Information
Summary of Net Oil and Gas Reserves
2013 2012 2011
Liquids in Millions of Barrels
Natural Gas in Billions of Cubic Feet
Crude Oil
Condensate
NGLs
Synthetic
Oil
Natural
Gas
Crude Oil
Condensate
NGLs
Synthetic
Oil
Natural
Gas
Crude Oil
Condensate
NGLs
Synthetic
Oil
Natural
Gas
Proved Developed
Consolidated Companies
U.S. 976 – 2,632 1,012 – 2,574 990 – 2,486
Other Americas 109 403 94 3 91 391 1,063 82 403 1,147
Africa 763 – 1,161 782 – 1,163 792 – 1,276
Asia 601 – 4,620 643 – 4,511 703 – 4,300
Australia 44 – 1,251 31 – 682 39 – 813
Europe 94 – 200 103 – 191 116 – 204
Total Consolidated 2,587 403 10,807 2,662 391 10,184 2,722 403 10,226
Aliated Companies
TCO 884 – 1,188 977 – 1,261 1,019 – 1,400
Other 105 44 330 115 50 377 93 50 75
Total Consolidated and Affiliated Companies 3,576 447 12,325 3,754 441 11,822 3,834 453 11,701
Proved Undeveloped
Consolidated Companies
U.S. 354 – 1,358 347 – 1,148 321 – 1,160
Other Americas 134 134 357 132 122 412 31 120 517
Africa 341 – 1,884 348 – 1,918 363 – 1,920
Asia 191 – 2,125 194 – 2,356 191 – 2,421
Australia 87 – 9,076 103 – 9,570 101 – 8,931
Europe 72 – 63 54 – 66 43 – 54
Tota l Consolidated 1,179 134 14,863 1,178 122 15,470 1,050 120 15,0 03
Affiliated Companies
TCO 784 – 1,102 755 – 1,038 740 – 851
Other 49 176 856 49 182 865 64 194 1,128
Total Consolidated and Affiliated Companies 2,012 310 16,821 1,982 304 17,373 1,854 314 16,982
Total Proved Reserves 5,588 757 29,146 5,736 745 29,195 5,688 767 28,683