Chevron 2013 Annual Report Download - page 44
Download and view the complete annual report
Please find page 44 of the 2013 Chevron annual report below. You can navigate through the pages in the report by either clicking on the pages listed below, or by using the keyword search tool below to find specific information within the annual report.-
 1
1 -
2
-
3
-
4
-
5
-
6
-
7
-
8
-
9
-
10
-
11
-
12
-
13
-
14
-
15
-
16
-
17
-
18
-
19
-
20
-
21
-
22
-
23
-
24
-
25
-
26
-
27
-
28
-
29
-
30
-
31
-
32
-
33
-
 34
34 -
 35
35 -
 36
36 -
 37
37 -
 38
38 -
 39
39 -
 40
40 -
 41
41 -
 42
42 -
 43
43 -
 44
44 -
 45
45 -
 46
46 -
 47
47 -
 48
48 -
 49
49 -
 50
50 -
 51
51 -
 52
52 -
 53
53 -
 54
54 -
55
-
56
-
57
-
58
-
59
-
60
-
61
-
62
-
63
-
64
-
65
-
66
-
67
-
68
-
69
-
70
-
71
-
72
-
73
-
74
-
75
-
76
-
77
-
78
-
79
-
80
-
81
-
82
-
83
-
84
-
85
-
86
-
87
-
88
 |
 |

42 Chevron Corporation 2013 Annual Report
“Cash and cash equivalents” do not include invest-
ments with a carrying/fair value of $1,210 and $1,454 at
December 31, 2013, and December 31, 2012, respectively. At
December 31, 2013, these investments are classied as Level
1 and include restricted funds related to tax payments and
certain upstream abandonment activities which are reported
in “Deferred charges and other assets” on the Consolidated
Balance Sheet. Long-term debt of $11,960 and $6,086 at
December 31, 2013, and December 31, 2012, had estimated
fair values of $12,267 and $6,770, respectively. Long-term
debt primarily includes corporate issued bonds. e fair value
of corporate bonds is $11,581 and classied as Level 1. e
fair value of the other bonds is $686 and classied as Level 2.
e carrying values of short-term nancial assets and
liabilities on the Consolidated Balance Sheet approximate their
fair values. Fair value remeasurements of other nancial instru-
ments at December 31, 2013 and 2012, were not material.
Note 10
Financial and Derivative Instruments
Derivative Commodity Instruments Chevron is exposed
to market risks related to price volatility of crude oil, rened
products, natural gas, natural gas liquids, liqueed natural gas
and renery feedstocks.
e company uses derivative commodity instruments to
manage these exposures on a portion of its activity, including
rm commitments and anticipated transactions for the pur-
chase, sale and storage of crude oil, rened products, natural
gas, natural gas liquids and feedstock for company reneries.
From time to time, the company also uses derivative commod-
ity instruments for limited trading purposes.
e company’s derivative commodity instruments princi-
pally include crude oil, natural gas and rened product futures,
swaps, options, and forward contracts. None of the company’s
derivative instruments is designated as a hedging instrument,
although certain of the company’s aliates make such des-
ignation. e company’s derivatives are not material to the
company’s nancial position, results of operations or liquidity.
e company believes it has no material market or credit risks
to its operations, nancial position or liquidity as a result of its
commodity derivative activities.
e company uses derivative commodity instruments
traded on the New York Mercantile Exchange and on electronic
platforms of the Inter-Continental Exchange and Chicago
Mercantile Exchange. In addition, the company enters into
swap contracts and option contracts principally with major
nancial institutions and other oil and gas companies in the
“over-the-counter” markets, which are governed by Interna-
tional Swaps and Derivatives Association agreements and other
master netting arrangements. Depending on the nature of the
derivative transactions, bilateral collateral arrangements may
also be required.
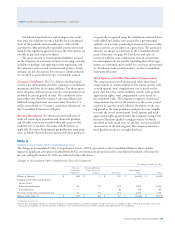
Derivative instruments measured at fair value at Decem-
ber 31, 2013, December 31, 2012, and December 31, 2011,
and their classication on the Consolidated Balance Sheet and
Consolidated Statement of Income are as follows:
Consolidated Balance Sheet: Fair Value of Derivatives Not
Designated as Hedging Instruments
Balance Sheet At December 31 At December 31
Typ e of C ontrac t Cl a ssi c at ion 2013 2012
Commodity Accounts and
notes receivable, net $ 22 $ 57
Commodity Long-term
receivables, net 6 29
Total Assets at Fair Value $ 28
$ 86
Commodity Accounts payable $ 65 $ 112
Commodity Deferred credits and other
noncurrent obligations 24 37
Total Liabilities at Fair Value $ 89 $ 149
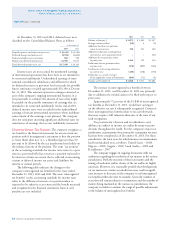
Consolidated Statement of Income: e Eect of Derivatives Not
Designated as Hedging Instruments
Gain/(Loss)
Type of Derivative Statement of Year ended December 31
Contract Income Classication 2013 2012 2011
Commodity Sales and other
operating revenues $ (108) $ (49) $ (255)
Commodity Purchased crude oil
and products (77) (24) 15
Commodity Other income (9) 6 (2)
$ (194) $ (67) $ (242)
Note 9 Fair Value Measurements – Continued
Notes to the Consolidated Financial Statements
Millions of dollars, except per-share amounts