Chevron 2013 Annual Report Download - page 23
Download and view the complete annual report
Please find page 23 of the 2013 Chevron annual report below. You can navigate through the pages in the report by either clicking on the pages listed below, or by using the keyword search tool below to find specific information within the annual report.-
 1
1 -
2
-
3
-
4
-
5
-
6
-
7
-
8
-
9
-
10
-
11
-
12
-
 13
13 -
 14
14 -
 15
15 -
 16
16 -
 17
17 -
 18
18 -
 19
19 -
 20
20 -
 21
21 -
 22
22 -
 23
23 -
 24
24 -
 25
25 -
 26
26 -
 27
27 -
 28
28 -
 29
29 -
 30
30 -
 31
31 -
 32
32 -
 33
33 -
34
-
35
-
36
-
37
-
38
-
39
-
40
-
41
-
42
-
43
-
44
-
45
-
46
-
47
-
48
-
49
-
50
-
51
-
52
-
53
-
54
-
55
-
56
-
57
-
58
-
59
-
60
-
61
-
62
-
63
-
64
-
65
-
66
-
67
-
68
-
69
-
70
-
71
-
72
-
73
-
74
-
75
-
76
-
77
-
78
-
79
-
80
-
81
-
82
-
83
-
84
-
85
-
86
-
87
-
88
 |
 |

Chevron Corporation 2013 Annual Report 21
Long-Term Unconditional Purchase Obligations and
Commitments, Including Throughput and Take-or-Pay
Agreements e company and its subsidiaries have certain
other contingent liabilities with respect to long-term uncon-
ditional purchase obligations and commitments, including
throughput and take-or-pay agreements, some of which relate
to suppliers’ nancing arrangements. e agreements typi-
cally provide goods and services, such as pipeline and storage
capacity, drilling rigs, utilities, and petroleum products, to be
used orsold in the ordinary course of the company’s business.
eaggregate approximate amounts of required payments
under these various commitments are: 2014 – $4.2 billion;
2015 – $4.5 billion; 2016 – $3.2 billion; 2017 – $2.6 billion;
2018 – $2.2 billion; 2019 and after – $6.9billion. A por-
tion of these commitments may ultimately be shared with
project partners. Total payments under the agreements were
approximately $3.6 billion in 2013, $3.6 billion in 2012 and
$6.6 billion in 2011.
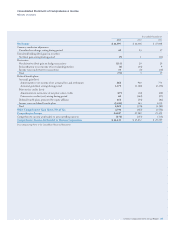
e following table summarizes the company’s signi-
cant contractual obligations:
Contractual Obligations1
Millions of dollars Payments Due by Period
2015– 2017– After
Total 2014 2016 2018 2018
On Balance Sheet:2
Short-Term Debt 3 $ 374 $ 374 $ — $ — $ —
Long-Term Debt3 19,960 — 8,750 4,000 7,210
Noncancelable Capital
Lease Obligations 177 45 52 34 46
Interest 2,611 335 659 606 1,011
O Balance Sheet:
Noncancelable Operating
Lease Obligations 3,709 798 1,327 778 806
roughput and
Take-or-Pay Agreements
4 15,320 2,679 4,372 2,587 5,682
Other Unconditional
Purchase Obligations
4 8,257 1,527 3,386 2,188 1,156
1 Excludes contributions for pensions and other postretirement benet plans.
Information on employee benet plans is contained in Note 21 beginning on
page 56.
2 Does not include amounts related to the company’s income tax liabilities associated with
uncertain tax positions. e company is unable to make reasonable estimates of the peri-
ods in which these liabilities may become payable. e company does not expect
settlement of such liabilities will have a material eect on its consolidated nancial posi-
tion or liquidity in any single period.
3 $8.0 billion of short-term debt that the company expects to renance is included in
long-term debt. e repayment schedule above reects the projected repayment of the
entire amounts in the 2015–2016 period.
4 Does not include commodity purchase obligations that are not xed or determinable.
ese obligations are generally monetized in a relatively short period of time through
sales transactions or similar agreements with third parties. Examples include obligations
to purchase LNG, regasied natural gas and renery products at indexed prices.
Financial and Derivative Instrument Market Risk
e market risk associated with the company’s portfolio of
nancial and derivative instruments is discussed on the next
page. e estimates of nancial exposure to market risk do
not represent the company’s projection of future market
changes. e actual impact of future market changes could
dier materially due to factors discussed elsewhere in this
report, including those set forth under the heading “Risk
Factors” in Part I, Item 1A, of the company’s 2013 Annual
Report on Form 10-K.
Financial Ratios
Financial Ratios
At December 31
2013 2012 2011
Current Ratio 1.5 1.6 1.6
Interest Coverage Ratio 126.2 191.3 165.4
Debt Ratio 12.1% 8.2% 7.7%
Current Ratio – current assets divided by current
liabilities, which indicates the company’s ability to repay
its short-term liabilities with short-term assets. e current
ratio in all periods was adversely aected by the fact that
Chevron’s inventories are valued on a last-in, rst-out basis.
At year-end 2013, the book value of inventory was lower than
replacement costs, based on average acquisition costs during
the year, by approximately $9.1 billion.
Interest Coverage Ratio – income before income tax
expense, plus interest and debt expense and amortization of
capitalized interest, less net income attributable to noncon-
trolling interests, divided by before-tax interest costs. is
ratio indicates the company’s ability to pay interest on out-
standing debt. e company’s interest coverage ratio in 2013
was lower than 2012 and 2011 due to lower income.
Debt Ratio – total debt as a percentage of total debt
plus Chevron Corporation Stockholders’ Equity, which indi-
cates the company’s leverage. e company’s debt ratio in
2013 was higher than 2012 and 2011 due to higher debt, par-
tially oset by a higher stockholder’s equity balance.
Guarantees, Off-Balance-Sheet Arrangements and
Contractual Obligations, and Other Contingencies
Direct Guarantees
Millions of dollars Commitment Expiration by Period
2015– 2017– After
Total 2014 2016 2018 2018
Guarantee of non-
consolidated aliate or
joint-venture obligations $ 524 $ 38 $ 76 $ 76 $ 334
e company’s guarantee of $524 million is associated
with certain payments under a terminal use agreement
entered into by an equity aliate. Over the approximate
14-year remaining term of the guarantee, the maximum
guarantee amount will be reduced as certain fees are paid by
the aliate. ere are numerous cross-indemnity agreements
with the aliate and the other partners to permit recovery
ofamounts paid under the guarantee. Chevron has recorded
no liability for its obligation under this guarantee.
Indemnifications Information related to indemnica-
tions is included on page 63 in Note 23 to the Consolidated
Financial Statements under the heading “Indemnications.”