Chevron 2013 Annual Report Download - page 47
Download and view the complete annual report
Please find page 47 of the 2013 Chevron annual report below. You can navigate through the pages in the report by either clicking on the pages listed below, or by using the keyword search tool below to find specific information within the annual report.-
 1
1 -
2
-
3
-
4
-
5
-
6
-
7
-
8
-
9
-
10
-
11
-
12
-
13
-
14
-
15
-
16
-
17
-
18
-
19
-
20
-
21
-
22
-
23
-
24
-
25
-
26
-
27
-
28
-
29
-
30
-
31
-
32
-
33
-
34
-
35
-
36
-
 37
37 -
 38
38 -
 39
39 -
 40
40 -
 41
41 -
 42
42 -
 43
43 -
 44
44 -
 45
45 -
 46
46 -
 47
47 -
 48
48 -
 49
49 -
 50
50 -
 51
51 -
 52
52 -
 53
53 -
 54
54 -
 55
55 -
 56
56 -
 57
57 -
58
-
59
-
60
-
61
-
62
-
63
-
64
-
65
-
66
-
67
-
68
-
69
-
70
-
71
-
72
-
73
-
74
-
75
-
76
-
77
-
78
-
79
-
80
-
81
-
82
-
83
-
84
-
85
-
86
-
87
-
88
 |
 |

Chevron Corporation 2013 Annual Report 45
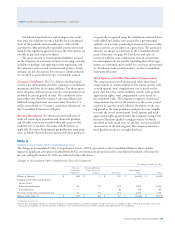
Note 11 Operating Segments and Geographic Data – Continued
Year ended December 31
2013 2012 2011
Upstream
United States $ 8,052 $ 6,416 $ 9,623
Intersegment 16,865 17,229 18,115
Total United States 24,917 23,645 27,738
International 17,607 19,459 20,086
Intersegment 33,034 34,094 35,012
Total International 50,641 53,553 55,098
Total Upstream 75,558 77,198 82,836
Downstream
United States 80,272 83,043 86,793
Excise and similar taxes 4,792 4,665 4,199
Intersegment 39 49 86
Total United States 85,103 87,757 91,078
International 105,373 113,279 119,254
Excise and similar taxes 3,699 3,346 3,886
Intersegment 859 80 81
Total International 109,931 116,705 123,221
Total Downstream 195,034 204,462 214,299
All Other
United States 358 378 526
Intersegment 1,524 1,300 1,072
Total United States 1,882 1,678 1,598
International 3 4 4
Intersegment 31 48 42
Total International 34 52 46
Total All Other 1,916 1,730 1,644
Segment Sales and Other
Operating Revenues
United States 111,902 113,080 120,414
International 160,606 170,310 178,365
Total Segment Sales and Other
Operating Revenues 272,508 283,390 298,779
Elimination of intersegment sales (52,352) (52,800) (54,408)
Total Sales and Other
Operating Revenues $ 220,156 $ 230,590 $ 244,371
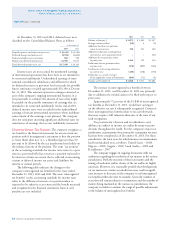
Segment Income Taxes Segment income tax expense for
the years 2013, 2012 and 2011 is as follows:
Year ended December 31
2013 2012 2011
Upstream
United States $ 2,333 $ 2,820 $ 3,701
International 12,470 16,554 16,743
Total Upstream 14,803 19,374 20,444
Downstream
United States 364 1,051 785
International 389 587 416
Total Downstream 753 1,638 1,201
All Other (1,248) (1,016) (1,019)
Total Income Tax Expense $ 14,308 $ 19,996 $ 20,626
Other Segment Information Additional information for
thesegmentation of major equity affiliates is contained in
Note 12. Information related to proper ties, plant and
equipment by segment is contained in Note 13, on page 47.
Note 12
Investments and Advances
Equity in earnings, together with investments in and advances
to companies accounted for using the equity method and other
investments accounted for at or below cost, is shown in the fol-
lowing table. For certain equity aliates, Chevron pays its share
of some income taxes directly. For such aliates, the equity in
earnings does not include these taxes, which are reported on the
Consolidated Statement of Income as “Income tax expense.”
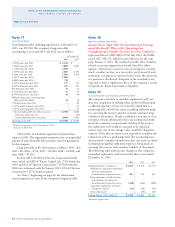
Investments and Advances Equity in Earnings
At December 31 Year ended December 31
2013 2012 2013 2012 2011
Upstream
Tengizchevroil $ 5,875 $ 5,451 $ 4,957 $ 4,614 $5,097
Petropiar 858 952 339 55 116
Caspian Pipeline Consortium 1,298 1,187 113 96 122
Petroboscan 1,375 1,261 300 229 247
Angola LNG Limited 3,423 3,186 (111) (106) (42)
Other 2,835 2,658 214 266 166
Tota l Upstrea m 15,664 14,695 5,812 5,154 5,706
Downstream
GS Caltex Corporation 2,518 2,610 132 249 248
Chevron Phillips Chemical
Company LLC 4,312 3,451 1,371 1,206 985
Star Petroleum Rening
Company Ltd. – – – 22 75
Caltex Australia Ltd. 1,020 835 224 77 117
Other 989 837 199 196 183
Tota l Downstream 8,839 7,733 1,926 1,750 1,608
All Other
Other 375 640 (211) (15) 49
Total equity method $ 24,878 $ 23,068 $ 7,527 $ 6,889 $ 7,363
Other at or below cost 624 650
Total investments and
advances $ 25,502 $ 23,718
Total United States $ 6,638 $ 5,788 $ 1,294 $ 1,268 $ 1,119
Tota l Inter n ationa l $ 18,864 $ 17,930 $ 6,233 $ 5,621 $ 6,244
Descriptions of major affiliates, including signicant
dierences between the company’s carrying value of its
investments and its underlying equity in the net assets of
the aliates, are as follows:
Tengizchevroil Chevron has a 50 percent equity ownership
interest in Tengizchevroil (TCO), which was formed in 1993
to develop the Tengiz and Korolev crude oil elds in Kazakh-
stan over a 40-year period. At December 31, 2013, the
company’s carrying value of its investment in TCO was about
$160 higher than the amount of underlying equity in TCO’s
net assets. is dierence results from Chevron acquiring
aportion of its interest in TCO at a value greater than the
underlying book value for that portion of TCO’s net assets.
See Note 7, on page 40, for summarized nancial
informa tion for 100 percent of TCO.