Chevron 2013 Annual Report Download - page 74
Download and view the complete annual report
Please find page 74 of the 2013 Chevron annual report below. You can navigate through the pages in the report by either clicking on the pages listed below, or by using the keyword search tool below to find specific information within the annual report.-
 1
1 -
2
-
3
-
4
-
5
-
6
-
7
-
8
-
9
-
10
-
11
-
12
-
13
-
14
-
15
-
16
-
17
-
18
-
19
-
20
-
21
-
22
-
23
-
24
-
25
-
26
-
27
-
28
-
29
-
30
-
31
-
32
-
33
-
34
-
35
-
36
-
37
-
38
-
39
-
40
-
41
-
42
-
43
-
44
-
45
-
46
-
47
-
48
-
49
-
50
-
51
-
52
-
53
-
54
-
55
-
56
-
57
-
58
-
59
-
60
-
61
-
62
-
63
-
 64
64 -
 65
65 -
 66
66 -
 67
67 -
 68
68 -
 69
69 -
 70
70 -
 71
71 -
 72
72 -
 73
73 -
 74
74 -
 75
75 -
 76
76 -
 77
77 -
 78
78 -
 79
79 -
 80
80 -
 81
81 -
 82
82 -
 83
83 -
 84
84 -
85
-
86
-
87
-
88
 |
 |

72 Chevron Corporation 2013 Annual Report
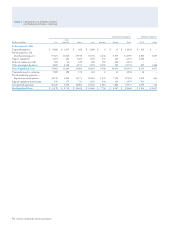
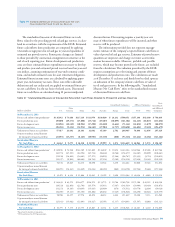
Table III – Results of Operations for Oil and Gas Producing Activities1, continued
Consolidated Companies Aliated Companies
Other
Millions of dollars U.S. Americas Africa Asia Australia Europe Total TCO Other
Year Ended December 31, 2011
Revenues from net production
Sales $ 2,508 $ 2,047 $ 1,174 $ 9,431 $ 1,474 $ 1,868 $ 18,502 $ 8,581 $ 1,988
Transfers 15,811 2,624 15,726 8,962 1,012 2,672 46,807 – –
Total 18,319 4,671 16,900 18,393 2,486 4,540 65,309 8,581 1,988
Production expenses excluding taxes (3,668) (1,061) (1,526) (4,489) (117) (564) (11,425) (449) (235)
Taxes other than on income (597) (137) (153) (242) (396) (2) (1,527) (429) (815)
Proved producing properties:
Depreciation and depletion (3,366) (796) (2,225) (2,923) (136) (580) (10,026) (442) (140)
Accretion expense2
(291) (27) (106) (81) (18) (39) (562) (8) (4)
Exploration expenses (207) (144) (188) (271) (128) (277) (1,215) – –
Unproved properties valuation (134) (146) (27) (60) – (14) (381) – –
Other income (expense)3 163 (466) (409) 231 (18) (74) (573) (8) (29)
Results before income taxes 10,219 1,894 12,266 10,558 1,673 2,990 39,600 7,245 765
Income tax expense (3,728) (535) (7,802) (5,374) (507) (1,913) (19,859) (2,176) (392)
Results of Producing Operations $ 6,491 $ 1,359 $ 4,464 $ 5,184 $ 1,166 $ 1,077 $ 19,741 $ 5,069 $ 373
1 e value of owned production consumed in operations as fuel has been eliminated from revenues and production expenses, and the related volumes have been deducted from net production in
calculating the unit average sales price and production cost. is has no eect on the results of producing operations.
2 Represents accretion of ARO liability. Refer to Note 24, “Asset Retirement Obligations,” on page 64.
3 Includes foreign currency gains and losses, gains and losses on property dispositions, and other miscellaneous income and expenses.
Table IV – Results of Operations for Oil and Gas Producing Activities – Unit Prices and Costs1
Consolidated Companies Aliated Companies
Other
U.S. Americas Africa Asia Australia Europe Total
TCO Other
Year Ended December 31, 2013
Average sales prices
Liquids, per barrel $ 93.46 $ 88.32 $ 107.22 $ 98.37 $ 103.28 $ 105.78 $ 99.05 $ 88.06 $ 78.87
Natural gas, per thousand cubic feet 3.38 2.68 1.76 6.02 10.61 11.04 5.45 1.50 4.00
Average production costs, per barrel2 19.57 21.29 13.93 16.49 5.90 22.87 17.10 4.37 22.69
Year Ended December 31, 2012
Average sales prices
Liquids, per barrel $ 95.21 $ 87.87 $ 109.64 $ 102.46 $ 103.06 $ 108.77 $ 101.61 $ 89.34 $ 83.97
Natural gas, per thousand cubic feet 2.65 3.59 1.22 6.03 10.99 10.10 5.42 1.36 5.39
Average production costs, per barrel2 16.99 18.38 12.14 16.71 4.86 15.72 15.46 4.42 18.73
Year Ended December 31, 2011
Average sales prices
Liquids, per barrel $ 97.51 $ 89.87 $ 109.45 $ 100.55 $ 103.70 $ 107.11 $ 101.63 $ 94.60 $ 90.90
Natural gas, per thousand cubic feet 4.02 2.97 0.41 5.28 9.98 9.91 5.29 1.60 6.57
Average production costs, per barrel2 15.08 14.62 9.48 17.47 3.41 11.44 13.98 4.23 10.54
1 e value of owned production consumed in operations as fuel has been eliminated from revenues and production expenses, and the related volumes have been deducted from net
production in calculating the unit average sales price and production cost. is has no eect on the results of producing operations.
2 Natural gas converted to oil-equivalent gas (OEG) barrels at a rate of 6 MCF = 1 OEG barrel.
Table III Results of Operations for Oil and
Gas Producing Activities1 – Continued