Chevron 2013 Annual Report Download - page 57
Download and view the complete annual report
Please find page 57 of the 2013 Chevron annual report below. You can navigate through the pages in the report by either clicking on the pages listed below, or by using the keyword search tool below to find specific information within the annual report.-
 1
1 -
2
-
3
-
4
-
5
-
6
-
7
-
8
-
9
-
10
-
11
-
12
-
13
-
14
-
15
-
16
-
17
-
18
-
19
-
20
-
21
-
22
-
23
-
24
-
25
-
26
-
27
-
28
-
29
-
30
-
31
-
32
-
33
-
34
-
35
-
36
-
37
-
38
-
39
-
40
-
41
-
42
-
43
-
44
-
45
-
46
-
 47
47 -
 48
48 -
 49
49 -
 50
50 -
 51
51 -
 52
52 -
 53
53 -
 54
54 -
 55
55 -
 56
56 -
 57
57 -
 58
58 -
 59
59 -
 60
60 -
 61
61 -
 62
62 -
 63
63 -
 64
64 -
 65
65 -
 66
66 -
 67
67 -
68
-
69
-
70
-
71
-
72
-
73
-
74
-
75
-
76
-
77
-
78
-
79
-
80
-
81
-
82
-
83
-
84
-
85
-
86
-
87
-
88
 |
 |

Chevron Corporation 2013 Annual Report 55
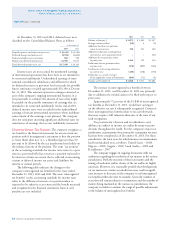
e following table provides an aging of capitalized well
costs and the number of projects for which exploratory well
costs have been capitalized for a period greater than one year
since the completion of drilling.
At December 31
2013 2012 2011
Exploratory well costs capitalized
for a period of one year or less $ 641 $ 501 $ 557
Exploratory well costs capitalized
for a period greater than one year 2,604 2,180 1,877
Balance at December 31 $ 3,245 $ 2,681 $ 2,434
Number of projects with exploratory
well costs that have been capitalized
for a period greater than one year* 51 46 47
* Certain projects have multiple wells or elds or both.
Of the $2,604 of exploratory well costs capitalized for
more than one year at December 31, 2013, $1,733 (22 proj-
ects) is related to projects that had drilling activities under
way or rmly planned for the near future. e $871 balance is
related to 29 projects in areas requiring a major capital expen-
diture before production could begin and for which additional
drilling eorts were not under way or rmly planned for the
near future. Additional drilling was not deemed necessary
because the presence of hydrocarbons had already been estab-
lished, and other activities were in process to enable a future
decision on project development.
e projects for the $871 referenced above had the fol-
lowing activities associated with assessing the reserves and the
projects’ economic viability: (a) $382 (six projects) – undergo-
ing front-end engineering and design with nal investment
decision expected within three years; (b) $47 (two projects)
– development concept under review by government; (c) $384
(nine projects) – development alternatives under review; (d)
$58 (twelve projects) – miscellaneous activities for projects
with smaller amounts suspended. While progress was being
made on all 51 projects, the decision on the recognition of
proved reserves under SEC rules in some cases may not occur
for several years because of the complexity, scale and negotia-
tions connected with the projects. Approximately half of these
decisions are expected to occur in the next three years.
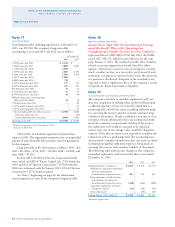
e $2,604 of suspended well costs capitalized for a
period greater than one year as of December 31, 2013, rep-
resents 191 exploratory wells in 51 projects. e tables below
contain the aging of these costs on a well and project basis:
Number
Aging based on drilling completion date of individual wells: Amount of wells
1997–2002 $ 120 28
2003–2007 531 46
2008–2012 1,953 117
Total $ 2,604 191
Aging based on drilling completion date of last Number
suspended well in project: Amount of projects
1999 $ 8 1
2003–2008 347 10
2009–2013 2,249 40
Total $ 2,604 51
Note 20
Stock Options and Other Share-Based Compensation
Compensation expense for stock options for 2013, 2012 and
2011 was $292 ($190 after tax), $283 ($184 after tax) and
$265 ($172 after tax), respectively. In addition, compensa-
tion expense for stock appreciation rights, restricted stock,
performance units and restricted stock units was $223 ($145
after tax), $177 ($115 after tax) and $214 ($139 after tax) for
2013, 2012 and 2011, respectively. No signicant stock-based
compensation cost was capitalized at December 31, 2013,
or December 31, 2012.
Cash received in payment for option exercises under all
share-based payment arrangements for 2013, 2012 and 2011
was $553, $753 and $948, respectively. Actual tax benets
realized for the tax deductions from option exercises were
$73, $101 and $121 for 2013, 2012 and 2011, respectively.
Cash paid to settle performance units and stock appre-
ciation rights was $186, $123 and $151 for 2013, 2012 and
2011, respectively.
Chevron Long-Term Incentive Plan (LTIP) Awards under
the LTIP may take the form of, but are not limited to, stock
options, restricted stock, restricted stock units, stock appreci-
ation rights, performance units and nonstock grants. From
April 2004 through May 2023, no more than 260 million
shares may be issued under the LTIP. For awards issued on or
after May 29, 2013, no more than 50 million of those shares
may be in a form other than a stock option, stock appreciation
right or award requiring full payment for shares by the award
recipient. For the major types of awards outstanding as of
December 31, 2013, the contractual terms vary between three
years for the performance units and 10 years for the stock
options and stock appreciation rights.
Note 19 Accounting for Suspended Exploratory Wells – Continued