Chevron 2013 Annual Report Download - page 77
Download and view the complete annual report
Please find page 77 of the 2013 Chevron annual report below. You can navigate through the pages in the report by either clicking on the pages listed below, or by using the keyword search tool below to find specific information within the annual report.-
 1
1 -
2
-
3
-
4
-
5
-
6
-
7
-
8
-
9
-
10
-
11
-
12
-
13
-
14
-
15
-
16
-
17
-
18
-
19
-
20
-
21
-
22
-
23
-
24
-
25
-
26
-
27
-
28
-
29
-
30
-
31
-
32
-
33
-
34
-
35
-
36
-
37
-
38
-
39
-
40
-
41
-
42
-
43
-
44
-
45
-
46
-
47
-
48
-
49
-
50
-
51
-
52
-
53
-
54
-
55
-
56
-
57
-
58
-
59
-
60
-
61
-
62
-
63
-
64
-
65
-
66
-
 67
67 -
 68
68 -
 69
69 -
 70
70 -
 71
71 -
 72
72 -
 73
73 -
 74
74 -
 75
75 -
 76
76 -
 77
77 -
 78
78 -
 79
79 -
 80
80 -
 81
81 -
 82
82 -
 83
83 -
 84
84 -
 85
85 -
 86
86 -
 87
87 -
88
 |
 |

Chevron Corporation 2013 Annual Report 75
At year-end 2013, the company held approximately 1.6 bil-
lion BOE of proved undeveloped reserves that have remained
undeveloped for ve years or more. e reserves are held by
consolidated and aliated companies and the majority of these
reserves are in locations where the company has a proven track
record of developing major projects.
In Africa, the majority of the approximately 300 million
BOE of proved undeveloped reserves that have remained unde-
veloped for ve years or more is related to deepwater and natural
gas developments in Nigeria. Major Nigerian deepwater develop-
ment projects include Agbami, which started production in 2008
and has ongoing development activities to maintain full utiliza-
tion of infrastructure capacity, and the Usan development, which
started production in 2012. Also in Nigeria, various elds and
infrastructure associated with the Escravos gas projects are cur-
rently under development.
In Asia, less than 200 million BOE remain classied as
proved undeveloped for more than ve years. e majority relate
to ongoing development activities in the Pattani Field in ailand
and the Azeri-Chirag-Gunashli elds in Azerbaijan.
Aliates account for 1.1 billion barrels of proved unde-
veloped reserves that have remained undeveloped for ve years
or more, with the majority related to the TCO aliate in
Kazakhstan. At TCO, further eld development to convert the
remaining proved undeveloped reserves is scheduled to occur in
line with reservoir depletion. In Venezuela, development drilling
continues at Hamaca to optimize utilization of upgrader capacity.
Annually, the company assesses whether any changes have
occurred in facts or circumstances, such as changes to develop-
ment plans, regulations or government policies, that would
warrant a revision to reserve estimates. For 2013, this assess-
ment did not result in any material changes in reserves classied
as proved undeveloped. Over the past three years, the ratio of
proved undeveloped reserves to total proved reserves has ranged
between 44 percent and 46 percent. e consistent completion
of major capital projects has kept the ratio in a narrow range over
this time period.
Proved Reserve Quantities At December 31, 2013,
proved reserves for the company were 11.2billion BOE.
Approximately 18 percent of the total reserves were located in
the United States.
Aside from the TCO aliate’s Tengiz Field in
Kazakhstan, no single property accounted for more than
5 percent of the company’s total oil-equivalent proved
reserves. About 18 other individual properties in the compa-
ny’s portfolio of assets each contained between 1 percent and
5 percent of the company’s oil-equivalent proved reserves,
which in the aggregate accounted for 44 percent of the com-
pany’s total oil-equivalent proved reserves. ese properties
were geographically dispersed, located in the United States,
Canada, South America, Africa, Asia and Australia.
In the United States, total proved reserves at year-end
2013 were 2.0 billion BOE. California properties accounted
for 30 percent of the U.S. reserves, with most classied as
heavy oil. Because of heavy oil’s high viscosity and the need
to employ enhanced recovery methods, most of the com-
pany’s heavy oil elds in California employ a continuous
steamooding process. e Gulf of Mexico region contains
26 percent of the U.S. reserves and production operations are
mostly oshore. Other U.S. areas represent the remaining
44 percent of U.S. reserves. For production of crude oil, some
elds utilize enhanced recovery methods, including water-
ooding and CO2 injection.
For the three years ending December 31, 2013, the pat-
tern of net reserve changes shown in the following tables are
not necessarily indicative of future trends. Apart from acqui-
sitions, the company’s ability to add proved reserves can be
aected by, among other things, events and circumstances
that are outside the company’s control, such as delays in gov-
ernment permitting, partner approvals of development plans,
changes in oil and gas prices, OPEC constraints, geopolitical
uncertainties, and civil unrest.
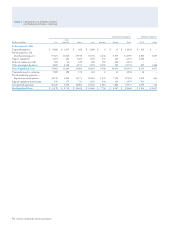
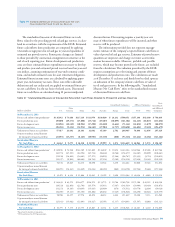
e company’s estimated net proved reserves of crude
oil, condensate, natural gas liquids and synthetic oil and
changes thereto for the years 2011, 2012 and 2013 are shown
in the table on page 76. e company’s estimated net proved
reserves of natural gas are shown on page 77.
Table V Reserve Quantity Information – Continued