Chevron 2013 Annual Report Download - page 78
Download and view the complete annual report
Please find page 78 of the 2013 Chevron annual report below. You can navigate through the pages in the report by either clicking on the pages listed below, or by using the keyword search tool below to find specific information within the annual report.-
 1
1 -
2
-
3
-
4
-
5
-
6
-
7
-
8
-
9
-
10
-
11
-
12
-
13
-
14
-
15
-
16
-
17
-
18
-
19
-
20
-
21
-
22
-
23
-
24
-
25
-
26
-
27
-
28
-
29
-
30
-
31
-
32
-
33
-
34
-
35
-
36
-
37
-
38
-
39
-
40
-
41
-
42
-
43
-
44
-
45
-
46
-
47
-
48
-
49
-
50
-
51
-
52
-
53
-
54
-
55
-
56
-
57
-
58
-
59
-
60
-
61
-
62
-
63
-
64
-
65
-
66
-
67
-
 68
68 -
 69
69 -
 70
70 -
 71
71 -
 72
72 -
 73
73 -
 74
74 -
 75
75 -
 76
76 -
 77
77 -
 78
78 -
 79
79 -
 80
80 -
 81
81 -
 82
82 -
 83
83 -
 84
84 -
 85
85 -
 86
86 -
 87
87 -
 88
88
 |
 |

76 Chevron Corporation 2013 Annual Report
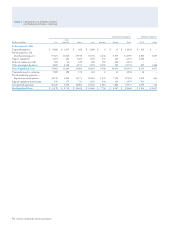
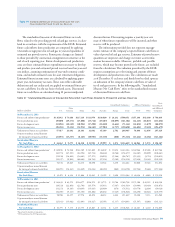
Table V Reserve Quantity Information – Continued
Net Proved Reserves (Developed and Undeveloped) of Crude Oil, Condensate, Natural Gas Liquids and Synthetic Oil
Tot a l
Consolidated Companies Aliated Companies
Consolidated
Other Synthetic
Synthetic and Aliated
Millions of barrels U.S. Americas1 Africa Asia Australia Europe Oil2 Total TCO Oil Other3 Companies
Reserves at January 1, 2011 1,275 108 1,168 1,013 88 152 466 4,270 1,820 256 157 6,503
Changes attributable to:
Revisions 63 4 60 25 (2) 15 32 197 28 – 10 235
Improved recovery 6 4 48 – – – – 58 – – – 58
Extensions and discoveries 140 30 34 4 65 26 – 299 – – – 299
Purchases 2 – – – – – 40 42 – – – 42
Sales (5) – – – (1) – – (6) – – – (6)
Production (170) (33) (155) (148) (10) (34) (15) (565) (89) (12) (10) (676)
Reserves at December 31, 20114 1,311 113 1,155 894 140 159 523 4,295 1,759 244 157 6,455
Changes attributable to:
Revisions 104 20 66 97 4 16 6 313 59 (6) 24 390
Improved recovery 24 8 30 6 – 9 – 77 – – – 77
Extensions and discoveries 77 101 30 2 7 – – 217 – – 1 218
Purchases 10 – – – – – – 10 – – – 10
Sales (1) – – (15) (7) – – (23) – – – (23)
Production (166) (19) (151) (147) (10) (27) (16) (536) (86) (6) (18) (646)
Reserves at December 31, 20124 1,359 223 1,130 837 134 157 513 4,353 1,732 232 164 6,481
Changes attributable to:
Revisions 55 25 94 84 7 17 40 322 32 (3) 3 354
Improved recovery 26 – 10 10 – 11 – 57 – – – 57
Extensions and discoveries 55 4 13 2 – 4 – 78 – – – 78
Purchases 2 9 – – – – – 11 – – – 11
Sales (3) – (1) – – – – (4) – – – (4)
Production (164) (18) (142) (141) (10) (23) (16) (514) (96) (9) (13) (632)
Reserves at December 31, 20134 1,330 243 1,104 792 131 166 537 4,303 1,668 220 154 6,345
1 Ending reserve balances in North America were 141, 121 and 13 and in South America were 102, 102 and 100 in 2013, 2012 and 2011, respectively.
Reserves associated with Canada.
3 Ending reserve balances in Africa were 37, 41 and 38 and in South America were 117, 123 and 119 in 2013, 2012 and 2011, respectively.
4 Included are year-end reserve quantities related to production-sharing contracts (PSC). PSC-related reserve quantities are 20 percent, 20 percent and 22 percent for consolidated companies for
2013, 2012 and 2011, respectively.
Noteworthy amounts in the categories of liquids proved
reserve changes for 2011 through 2013 are discussed below:
Revisions In 2011, net revisions increased reserves 235
million barrels. For consolidated companies, improved reser-
voir performance accounted for a majority of the 63 million
barrel increase in the United States. In Africa, improved eld
performance drove the 60 million barrel increase. In Asia,
increases from improved reservoir performance were partially
oset by the eects of higher prices on entitlement volumes.
Synthetic oil reserves in Canada increased by 32 million
barrels, primarily due to geotechnical revisions. For aliated
companies, improved facility and reservoir performance was
partially oset by the price eect on entitlement volumes
at TCO.
In 2012, net revisions increased reserves 390 million
barrels. Improved eld performance and drilling associated
with Gulf of Mexico projects accounted for the majority of
the 104 million barrel increase in the United States. In Asia,
drilling results across numerous assets drove the 97 million
barrel increase. Improved eld performance from various
Nigeria and Angola producing assets was primarily respon-
sible for the 66 million barrel increase in Africa. Improved
plant eciency for the TCO aliate was responsible for a
large portion of the 59 million barrel increase.
In 2013, net revisions increased reserves 354 million
barrels. Improved eld performance from various Nigeria
and Angola producing assets was primarily responsible for
the 94 million barrel increase in Africa. In Asia, drilling
performance across numerous assets resulted in an 84 mil-
lion barrel increase. Improved eld performance and drilling
associated with Gulf of Mexico projects and drilling in the
Midland and Delaware basins accounted for the majority of
the 55 million barrel increase in the United States. Synthetic
oil reserves in Canada increased by 40 million barrels, pri-
marily due to improved eld performance.
Improved Recovery In 2011, improved recovery
increased volumes by 58 million barrels. Reserves in Africa
increased 48 million barrels due primarily to secondary
recovery performance in Nigeria.
In 2012, improved recovery increased reserves by 77 mil-
lion barrels, primarily due to secondary recovery performance
in Africa and in Gulf of Mexico elds in the United States.