Chevron 2013 Annual Report Download - page 43
Download and view the complete annual report
Please find page 43 of the 2013 Chevron annual report below. You can navigate through the pages in the report by either clicking on the pages listed below, or by using the keyword search tool below to find specific information within the annual report.-
 1
1 -
2
-
3
-
4
-
5
-
6
-
7
-
8
-
9
-
10
-
11
-
12
-
13
-
14
-
15
-
16
-
17
-
18
-
19
-
20
-
21
-
22
-
23
-
24
-
25
-
26
-
27
-
28
-
29
-
30
-
31
-
32
-
 33
33 -
 34
34 -
 35
35 -
 36
36 -
 37
37 -
 38
38 -
 39
39 -
 40
40 -
 41
41 -
 42
42 -
 43
43 -
 44
44 -
 45
45 -
 46
46 -
 47
47 -
 48
48 -
 49
49 -
 50
50 -
 51
51 -
 52
52 -
 53
53 -
54
-
55
-
56
-
57
-
58
-
59
-
60
-
61
-
62
-
63
-
64
-
65
-
66
-
67
-
68
-
69
-
70
-
71
-
72
-
73
-
74
-
75
-
76
-
77
-
78
-
79
-
80
-
81
-
82
-
83
-
84
-
85
-
86
-
87
-
88
 |
 |

Chevron Corporation 2013 Annual Report 41
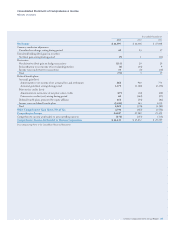
Assets and Liabilities Measured at Fair Value on a Recurring Basis
At December 31, 2013 At December 31, 2012
Total Level 1 Level 2 Level 3 Total Level 1 Level 2 Level 3
Marketable securities $ 263 $ 263 $ – $ – $ 266 $ 266 $ – $ –
Derivatives 28 – 28 – 86 21 65 –
Total Assets at Fair Value $ 291 $ 263 $ 28 $ – $ 352 $ 287 $ 65 $ –
Derivatives 89 80 9 – 149 148 1 –
Total Liabilities at Fair Value $ 89 $ 80 $ 9 $ – $ 149 $ 148 $ 1 $ –
Assets and Liabilities Measured at Fair Value on a Nonrecurring Basis
At December 31 At December 31
Total Level 1 Level 2 Level 3
Before-Tax
Loss
Year 2013 Total Level 1 Level 2 Level 3
Before-Tax
Loss
Year 2012
Properties, plant and
equipment, net
(held and used) $ 102 $ – $ – $ 102 $ 278 $ 84 $ – $ – $ 84 $ 213
Properties, plant and
equipment, net
(held for sale) 69 – 69 – 104 16 – – 16 17
Investments and advances 38 – 35 3 228 – – – – 15
Total Nonrecurring
Assets at Fair Value $ 209 $ – $ 104 $ 105 $ 610 $ 100 $ – $ – $ 100 $ 245
Note 9 Fair Value Measurements – Continued
e tables below show the fair value hierarchy for assets and
liabilities measured at fair value on a recurring and nonrecur-
ring basis at December 31, 2013, and December 31, 2012.
Marketable Securities e company calculates fair value
for its marketable securities based on quoted market prices
for identical assets. e fair values reect the cash that would
have been received if the instruments were sold at December
31, 2013.
Derivatives e company records its derivative instruments
– other than any commodity derivative contracts that
are designated as normal purchase and normal sale – on
the Consolidated Balance Sheet at fair value, with the
osetting amount to the Consolidated Statement of Income.
Derivatives classied as Level 1 include futures, swaps and
options contracts traded in active markets such as the New
York Mercantile Exchange. Derivatives classied as Level 2
include swaps, options, and forward contracts, principally
with nancial institutions and other oil and gas companies,
the fair values of which are obtained from third-party
broker quotes, industry pricing services and exchanges. e
company obtains multiple sources of pricing information
for the Level 2 instruments. Since this pricing information
is generated from observable market data, it has historically
been very consistent. e company does not materially adjust
this information.
Properties, Plant and Equipment e company did not
have any material long-lived assets measured at fair value on a
nonrecurring basis to report in 2013 or 2012.
Investments and Advances e company did not have any
material investments and advances measured at fair value on a
nonrecurring basis to report in 2013 or 2012.
Assets and Liabilities Not Required to Be Measured at
Fair Value e company holds cash equivalents and bank
time deposits in U.S. and non-U.S. portfolios. e instru-
ments classied as cash equivalents are primarily bank time
deposits with maturities of 90 days or less and money market
funds. “Cash and cash equivalents” had carrying/fair values
of $16,245 and $20,939 at December 31, 2013, and Decem-
ber 31, 2012, respectively. e instruments held in “Time
deposits” are bank time deposits with maturities greater
than 90 days, and had carrying/fair values of $8 and $708
at December 31, 2013, and December 31, 2012, respectively.
e fair values of cash, cash equivalents and bank time depos-
its are classied as Level 1 and reect the cash that would
have been received if the instruments were settled at Decem-
ber 31, 2013.