Chevron 2013 Annual Report Download - page 22
Download and view the complete annual report
Please find page 22 of the 2013 Chevron annual report below. You can navigate through the pages in the report by either clicking on the pages listed below, or by using the keyword search tool below to find specific information within the annual report.-
 1
1 -
2
-
3
-
4
-
5
-
6
-
7
-
8
-
9
-
10
-
11
-
 12
12 -
 13
13 -
 14
14 -
 15
15 -
 16
16 -
 17
17 -
 18
18 -
 19
19 -
 20
20 -
 21
21 -
 22
22 -
 23
23 -
 24
24 -
 25
25 -
 26
26 -
 27
27 -
 28
28 -
 29
29 -
 30
30 -
 31
31 -
 32
32 -
33
-
34
-
35
-
36
-
37
-
38
-
39
-
40
-
41
-
42
-
43
-
44
-
45
-
46
-
47
-
48
-
49
-
50
-
51
-
52
-
53
-
54
-
55
-
56
-
57
-
58
-
59
-
60
-
61
-
62
-
63
-
64
-
65
-
66
-
67
-
68
-
69
-
70
-
71
-
72
-
73
-
74
-
75
-
76
-
77
-
78
-
79
-
80
-
81
-
82
-
83
-
84
-
85
-
86
-
87
-
88
 |
 |

Management’s Discussion and Analysis of
Financial Condition and Results of Operations
20 Chevron Corporation 2013 Annual Report
Capital and Exploratory Expenditures Tot a l expendi-
tures for 2013 were $41.9 billion, including $2.7 billion for the
company’s share of equity-aliate expenditures, which did not
require cash outlays by the company. In 2012 and 2011, expen-
ditures were $34.2 billion and $29.1 billion, respectively,
including the company’s share of aliates’ expenditures of
$2.1 billion and $1.7 billion, respectively.
Expenditures for 2013 include approximately $4 billion
for major resource acquisitions in Argentina, Australia, the
Permian Basin and the Kurdistan Region of Iraq, along with
additional acreage in the Duvernay Shale and interests in the
Kitimat LNG Project in Canada. In addition, work progressed
on a number of major capital projects, particularly two Austra-
lian LNG projects and two deepwater Gulf of Mexico projects.
Of the $41.9 billion of expenditures in 2013, 90 percent,
or $37.9 billion, was related to upstream activities. Approxi-
mately 89 percent was expended for upstream operations in
2012 and 2011. International upstream accounted for 78 per-
cent of the worldwide upstream investment in 2013,
72percent in 2012 and 68 percent in 2011. ese amounts
exclude the acquisition of Atlas Energy, Inc. in 2011.
e company estimates that 2014 capital and exploratory
expenditures will be $39.8 billion, including $4.8 billion of
spending by aliates. Approximately 90 percent of thetotal,
or $35.8 billion, is budgeted for exploration and production
activities. Approximately $27.9 billion, or 78 percent, of this
amount is for projects outside the United States. Spending in
2014 is primarily focused on major development projects in
Angola, Argentina, Australia, Canada, Kazakhstan, Nigeria,
Republic of the Congo, Russia, the United Kingdom and the
U.S. Also included is funding for enhancing recovery and miti-
gating natural eld declines for currently-producing assets, and
for focused exploration and appraisal activities.
Worldwide downstream spending in 2014 is estimated at
$3.1 billion, with $1.8 billion for projects in the United States.
Major capital outlays include projects under construction
at reneries in the United States and expansion of additives
production capacity in Singapore. Additional investments are
expected to be funded by CPChem for chemicals projects in
the United States.
Investments in technology companies, power and energy
services, and other corporate businesses in 2014 are budgeted
at $1 billion.
Noncontrolling Interests e company had noncon-
trolling interests of $1.3 billion at both December 31, 2013
and 2012. Distributions to noncontrolling interests totaled
$99 million and $41 million in 2013 and 2012, respectively.
Pension Obligations Information related to pension
plan contributions is included on page 61 in Note 21 to the
Consolidated Financial Statements under the heading “Cash
Contributions and Benet Payments.”
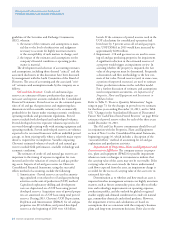
0.0
16.0
12.0
4.0
8.0
Percent
The ratio increased to 12.1 percent
at the end of 2013 due to higher
debt, partially offset by an increase
in stockholders’ equity.
Ratio of Total Debt to Total
Debt-Plus-Chevron Corporation
Stockholders’ Equity
1009 11 12 13
12.1%
0.0
40.0
20.0
30.0
10.0
Upstream —
Capital & Exploratory
Expenditures*
Billions of dollars
United States
International
Exploration and production
expenditures were 24 percent
higher than 2012.
* Includes equity in affiliates.
Excludes the acquisition of Atlas
Energy, Inc. in 2011.
1009 11 12 13
$37.9
Capital and Exploratory Expenditures
2013 2012 2011
Millions of dollars U.S. Int’l. Total U.S. Int’l. Total U.S. Int’l. Total
Upstream1 $ 8,480 $ 29,378 $ 37,858 $ 8,531 $ 21,913 $ 30,444 $ 8,318 $ 17,554 $ 25,872
Downstream 1,986 1,189 3,175 1,913 1,259 3,172 1,461 1,150 2,611
All Other 821 23 844 602 11 613 575 8 583
Total $ 11,287 $ 30,590 $ 41,877 $ 11,046 $ 23,183 $ 34,229 $ 10,354 $ 18,712 $ 29,066
Total, Excluding Equity in Aliates $ 10,562 $ 28,617 $ 39,179 $10,738 $ 21,374 $ 32,112 $ 10,077 $ 17,294 $ 27,371
1 Excludes the acquisition of Atlas Energy, Inc. in 2011.