Chevron 2013 Annual Report Download - page 72
Download and view the complete annual report
Please find page 72 of the 2013 Chevron annual report below. You can navigate through the pages in the report by either clicking on the pages listed below, or by using the keyword search tool below to find specific information within the annual report.-
 1
1 -
2
-
3
-
4
-
5
-
6
-
7
-
8
-
9
-
10
-
11
-
12
-
13
-
14
-
15
-
16
-
17
-
18
-
19
-
20
-
21
-
22
-
23
-
24
-
25
-
26
-
27
-
28
-
29
-
30
-
31
-
32
-
33
-
34
-
35
-
36
-
37
-
38
-
39
-
40
-
41
-
42
-
43
-
44
-
45
-
46
-
47
-
48
-
49
-
50
-
51
-
52
-
53
-
54
-
55
-
56
-
57
-
58
-
59
-
60
-
61
-
 62
62 -
 63
63 -
 64
64 -
 65
65 -
 66
66 -
 67
67 -
 68
68 -
 69
69 -
 70
70 -
 71
71 -
 72
72 -
 73
73 -
 74
74 -
 75
75 -
 76
76 -
 77
77 -
 78
78 -
 79
79 -
 80
80 -
 81
81 -
 82
82 -
83
-
84
-
85
-
86
-
87
-
88
 |
 |

70 Chevron Corporation 2013 Annual Report
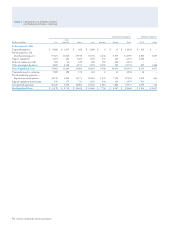
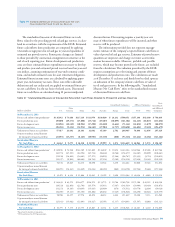
Consolidated Companies Aliated Companies
Other
Millions of dollars U.S. Americas Africa Asia Australia Europe Total
TCO Other
At December 31, 2011
Unproved properties $ 9,806 $ 1,417 $ 368 $ 2,408 $ 6 $ 33 $ 14,038 $ 109 $ –
Proved properties and
related producing assets 57,674 11,029 25,549 36,740 2,244 9,549 142,785 6,583 1,607
Support equipment 1,071 292 1,362 1,544 533 169 4,971 1,018 –
Deferred exploratory wells 565 63 629 260 709 208 2,434 – –
Other uncompleted projects 4,887 2,408 4,773 3,109 6,076 492 21,745 605 1,466
Gross Capitalized Costs 74,003 15,209 32,681 44,061 9,568 10,451 185,973 8,315 3,073
Unproved properties valuation 1,085 498 178 262 2 13 2,038 38 –
Proved producing properties –
Depreciation and depletion 39,210 4,826 13,173 20,991 1,574 7,742 87,516 1,910 436
Support equipment depreciation 530 175 715 1,192 238 129 2,979 451 –
Accumulated provisions 40,825 5,499 14,066 22,445 1,814 7,884 92,533 2,399 436
Net Capitalized Costs $ 33,178 $ 9,710 $ 18,615 $ 21,616 $ 7,754 $ 2,567 $ 93,440 $ 5,916 $ 2,637
Table II Capitalized Costs Related to Oil and
Gas Producing Activities – Continued