Chevron 2013 Annual Report Download - page 46
Download and view the complete annual report
Please find page 46 of the 2013 Chevron annual report below. You can navigate through the pages in the report by either clicking on the pages listed below, or by using the keyword search tool below to find specific information within the annual report.-
 1
1 -
2
-
3
-
4
-
5
-
6
-
7
-
8
-
9
-
10
-
11
-
12
-
13
-
14
-
15
-
16
-
17
-
18
-
19
-
20
-
21
-
22
-
23
-
24
-
25
-
26
-
27
-
28
-
29
-
30
-
31
-
32
-
33
-
34
-
35
-
 36
36 -
 37
37 -
 38
38 -
 39
39 -
 40
40 -
 41
41 -
 42
42 -
 43
43 -
 44
44 -
 45
45 -
 46
46 -
 47
47 -
 48
48 -
 49
49 -
 50
50 -
 51
51 -
 52
52 -
 53
53 -
 54
54 -
 55
55 -
 56
56 -
57
-
58
-
59
-
60
-
61
-
62
-
63
-
64
-
65
-
66
-
67
-
68
-
69
-
70
-
71
-
72
-
73
-
74
-
75
-
76
-
77
-
78
-
79
-
80
-
81
-
82
-
83
-
84
-
85
-
86
-
87
-
88
 |
 |

44 Chevron Corporation 2013 Annual Report
exploratory budgets. However, business-unit managers within
the operating segments are directly responsible for decisions
relating to project implementation and all other matters con-
nected with daily operations. Company ocers who are
members of the EXCOM also have individual management
responsibilities and participate in other committees for pur-
poses other than acting as the CODM.
e company’s primary country of operation is the
United States of America, its country of domicile. Other
components of the company’s operations are reported as
“International” (outside the United States).
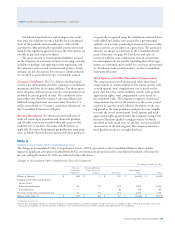
Segment Earnings e company evaluates the performance
of its operating segments on an after-tax basis, without con-
sidering the eects of debt nancing interest expense or
investment interest income, both of which are managed by the
company on a worldwide basis. Corporate administrative
costs and assets are not allocated to the operating segments.
However, operating segments are billed for the direct use of
corporate services. Nonbillable costs remain at the corporate
level in “All Other.” Earnings by major operating area are pre-
sented in the following table:
Year ended December 31
2013 2012 2011
Segment Earnings
Upstream
United States $ 4,044 $ 5,332 $ 6,512
International 16,765 18,456 18,274
Total Upstream 20,809 23,788 24,786
Downstream
United States 787 2,048 1,506
International 1,450 2,251 2,085
Total Downstream 2,237 4,299 3,591
Total Segment Earnings 23,046 28,087 28,377
All Other
Interest income 80 83 78
Other (1,703) (1,991) (1,560)
Net Income Attributable
to Chevron Corporation $ 21,423 $ 26,179 $ 26,895
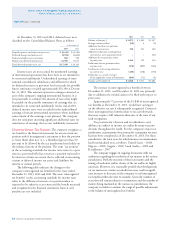
Segment Assets Segment assets do not include intercompany
investments or intercompany receivables. Segment assets at
year-end 2013 and 2012 are as follows:
At December 31
2013 2012
Upstream
United States $ 45,436 $ 41,891
International 137,096 115,806
Goodwill 4,639 4,640
Total Upstream 187,171 162,337
Downstream
United States 23,829 23,023
International 20,268 20,024
Total Downstream 44,097 43,047
Total Segment Assets 231,268 205,384
All Other
United States 7,326 7,727
International 15,159 19,871
Total All Other 22,485 27,598
Total Assets – United States 76,591 72,641
Total Assets – International 172,523 155,701
Goodwill 4,639 4,640
Total Assets $ 253,753 $ 232,982
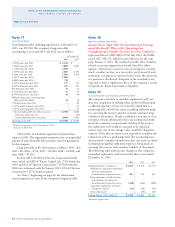
Segment Sales and Other Operating Revenues Operat-
ing segment sales and other operating revenues, including
internal transfers, for the years 2013, 2012 and 2011, are
presented in the table that follows. Products are transferred
between operating segments at internal product values that
approximate market prices.
Revenues for the upstream segment are derived primarily
from the production and sale of crude oil and natural gas,
as well as the sale of third-party production of natural gas.
Revenues for the downstream segment are derived from the
rening and marketing of petroleum products such as gaso-
line, jet fuel, gas oils, lubricants, residual fuel oils and other
products derived from crude oil. is segment also gener-
ates revenues from the manufacture and sale of additives for
fuels and lubricant oils and the transportation and trading of
rened products, crude oil and natural gas liquids.
Note 11 Operating Segments and Geographic Data – Continued
Notes to the Consolidated Financial Statements
Millions of dollars, except per-share amounts