Chevron 2013 Annual Report Download - page 67
Download and view the complete annual report
Please find page 67 of the 2013 Chevron annual report below. You can navigate through the pages in the report by either clicking on the pages listed below, or by using the keyword search tool below to find specific information within the annual report.-
 1
1 -
2
-
3
-
4
-
5
-
6
-
7
-
8
-
9
-
10
-
11
-
12
-
13
-
14
-
15
-
16
-
17
-
18
-
19
-
20
-
21
-
22
-
23
-
24
-
25
-
26
-
27
-
28
-
29
-
30
-
31
-
32
-
33
-
34
-
35
-
36
-
37
-
38
-
39
-
40
-
41
-
42
-
43
-
44
-
45
-
46
-
47
-
48
-
49
-
50
-
51
-
52
-
53
-
54
-
55
-
56
-
 57
57 -
 58
58 -
 59
59 -
 60
60 -
 61
61 -
 62
62 -
 63
63 -
 64
64 -
 65
65 -
 66
66 -
 67
67 -
 68
68 -
 69
69 -
 70
70 -
 71
71 -
 72
72 -
 73
73 -
 74
74 -
 75
75 -
 76
76 -
 77
77 -
78
-
79
-
80
-
81
-
82
-
83
-
84
-
85
-
86
-
87
-
88
 |
 |

Chevron Corporation 2013 Annual Report 65
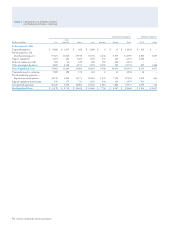
Note 27
Earnings Per Share
Basic earnings per share (EPS) is based upon “Net Income Attributable to Chevron Corporation” (“earnings”) and includes the
eects ofdeferrals of salary and other compensation awards that areinvested in Chevron stock units by certain ocers and
employees of the company. Diluted EPSincludes the eects of these items as well as the dilu tive eects of outstanding stock
options awarded under the company’s stock option programs (refer to Note 20, “Stock Options and Other Share-Based Compen-
sation,” beginning on page 55). e table below sets forth the computation ofbasic and diluted EPS:
Year ended December 31
2013 2012 2011
Basic EPS Calculation
Earnings available to common stockholders – Basic* $ 21,423 $ 26,179 $ 26,895
Weighted-average number of common shares outstanding 1,916 1,950 1,986
Add: Deferred awards held as stock units 1 – –
Total weighted-average number of common shares outstanding 1,917 1,950 1,986
Earnings per share of common stock – Basic $ 11.18 $ 13.42 $ 13.54
Diluted EPS Calculation
Earnings available to common stockholders – Diluted* $ 21,423 $ 26,179 $ 26,895
Weighted-average number of common shares outstanding 1,916 1,950 1,986
Add: Deferred awards held as stock units 1 – –
Add: Dilutive eect of employee stock-based awards 15 15 15
Total weighted-average number of common shares outstanding 1,932 1,965 2,001
Earnings per share of common stock – Diluted $ 11.09 $ 13.32 $ 13.44
*ere was no eect of dividend equivalents paid on stock units or dilutive impact of employee stock-based awards on earnings.
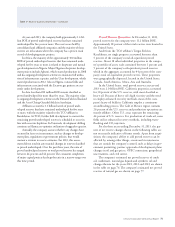
Note 25 Other Financial Information
Note 25
Other Financial Information
Earnings in 2013 included after-tax gains of approximately
$500 relating to the sale of nonstrategic properties. Of this
amount, approximately $300 and $200 related to down-
stream and upstream assets, respectively. Earnings in 2012
included after-tax gains of approximately $2,800 relat-
ing to the sale of nonstrategic properties. Of this amount,
approximately $2,200 and $600 related to upstream and
downstream assets, respectively.
Other nancial information is as follows:
Year ended December 31
2013 2012 2011
Total nancing interest and debt costs $ 284 $ 242 $ 288
Less: Capitalized interest 284 242 288
Interest and debt expense $ – $ – $ –
Research and development expenses $ 750 $ 648 $ 627
Foreign currency eects* $ 474 $ (454) $ 121
*
Includes $244, $(202) and $(27) in 2013, 2012 and 2011, respectively, for the com-
pany’s share of equity aliates’ foreign currency eects.
e excess of replacement cost over the carrying value
of inventories for which the last-in, rst-out (LIFO) method
is used was $9,150, and $9,292 at December 31, 2013 and
2012, respectively. Replacement cost is generally based on
average acquisition costs for the year. LIFO prots (charges)
of $14, $121 and $193 were included in earnings for the years
2013, 2012 and 2011, respectively.
e company has $4,639 in goodwill on the Con-
solidated Balance Sheet related to the 2005 acquisition of
Unocal and to the 2011 acquisition of Atlas Energy, Inc. e
company tested this goodwill for impairment during 2013
and concluded no impairment was necessary.
Note 26
Assets Held for Sale
At December 31, 2013, the company classied $580 of net
properties, plant and equipment as “Assets Held for Sale” on
the Consolidated Balance Sheet. ese assets are associated
with upstream operations that are anticipated to be sold in
2014. e revenues and earnings contributions of these assets
in 2013 were not material.