Chevron 2013 Annual Report Download - page 40
Download and view the complete annual report
Please find page 40 of the 2013 Chevron annual report below. You can navigate through the pages in the report by either clicking on the pages listed below, or by using the keyword search tool below to find specific information within the annual report.-
 1
1 -
2
-
3
-
4
-
5
-
6
-
7
-
8
-
9
-
10
-
11
-
12
-
13
-
14
-
15
-
16
-
17
-
18
-
19
-
20
-
21
-
22
-
23
-
24
-
25
-
26
-
27
-
28
-
29
-
 30
30 -
 31
31 -
 32
32 -
 33
33 -
 34
34 -
 35
35 -
 36
36 -
 37
37 -
 38
38 -
 39
39 -
 40
40 -
 41
41 -
 42
42 -
 43
43 -
 44
44 -
 45
45 -
 46
46 -
 47
47 -
 48
48 -
 49
49 -
 50
50 -
51
-
52
-
53
-
54
-
55
-
56
-
57
-
58
-
59
-
60
-
61
-
62
-
63
-
64
-
65
-
66
-
67
-
68
-
69
-
70
-
71
-
72
-
73
-
74
-
75
-
76
-
77
-
78
-
79
-
80
-
81
-
82
-
83
-
84
-
85
-
86
-
87
-
88
 |
 |

38 Chevron Corporation 2013 Annual Report
Note 3
Noncontrolling Interests
Ownership interests in the company’s subsidiaries held by
parties other than the parent are presented separately from
the parent’s equity on the Consolidated Balance Sheet. e
amount of consolidated net income attributable to the par-
ent and the noncontrolling interests are both presented on
the face of the Consolidated Statement of Income. e term
“earnings” is dened as “Net Income Attributable to Chevron
Corporation.”
Activity for the equity attributable to noncontrolling
interests for 2013, 2012 and 2011 is as follows:
2013 2012 2011
Balance at January 1 $ 1,308 $ 799 $ 730
Net income 174 157 113
Distributions to noncontrolling interests (99) (41) (71)
Other changes, net* (69) 393 27
Balance at December 31 $ 1,314 $ 1,308 $ 799
* Includes components of comprehensive income, which are disclosed separately in the
Consolidated Statement of Comprehensive Income.
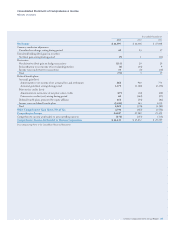
Note 4
Information Relating to the Consolidated Statement of Cash Flows
Year ended December 31
2013 2012 2011
Net (increase) decrease in operating
working capital was composed of the
following:
(Increase) decrease in accounts and
notes receivable $ (1,101) $ 1,153 $ (2,156)
Increase in inventories (237) (233) (404)
Decrease (increase) in prepaid
expenses and other current assets 834 (471) (853)
Increase in accounts payable
and accrued liabilities 160 544 3,839
(Decrease) increase in income and
other taxes payable (987) (630) 1,892
Net (increase) decrease in operating
working capital $ (1,331) $ 363 $ 2,318
Net cash provided by operating
activities includes the following
cash payments for income taxes:
Income taxes $ 12,898 $ 17,334 $ 17,374
Net sales (purchases) of marketable
securities consisted of the following
gross amounts:
Marketable securities purchased $ (7) $ (35) $ (112)
Marketable securities sold 10 32 38
Net sales (purchases) of marketable
securities $ 3 $ (3) $ (74)
Net sales (purchases) of time deposits
consisted of the following
gross amounts:
Time deposits purchased $ (2,317) $ (717) $ (6,439)
Time deposits matured 3,017 3,967 5,335
Net sales (purchases) of time deposits $ 700 $ 3,250 $ (1,104)
e “Net (increase) decrease in operating working capital”
includes reductions of $79, $98 and $121 for excess income
tax benets associated with stock options exercised during
2013, 2012 and 2011, respectively. ese amounts are oset
by an equal amount in “Net purchases of treasury shares.”
“Other” includes changes in postretirement benets obliga-
tions and other long-term liabilities.
In February 2011, the company acquired Atlas Energy,
Inc. (Atlas) for the aggregate purchase price of approximately
$4,500. e purchase price included assumption of debt
and certain payments noted below. e “Acquisition of Atlas
Energy” reects the $3,009 cash paid for all the common
shares of Atlas. An “Advance to Atlas Energy” of $403 was
made to facilitate the purchase of a 49 percent interest in
Laurel Mountain Midstream LLC on the day of closing. e
“Repayments of long-term debt and other nancing obliga-
tions” in 2011 includes $761 for repayment of Atlas debt and
$271 for payo of the Atlas revolving credit facility. e “Net
(increase) decrease in operating working capital” includes
$184 for payments made in connection with Atlas equity
awards subsequent to the acquisition. e remaining impacts
of the acquisition did not have a material impact on the Con-
solidated Statement of Cash Flows.
e “Net purchases of treasury shares” represents the cost of
common shares acquired less the cost of shares issued for share-
based compensation plans. Purchases totaled $5,004, $5,004 and
$4,262 in 2013, 2012 and 2011, respectively. In 2013, 2012 and
2011, the company purchased 41.6 million, 46.6 million and
42.3 million common shares for $5,000, $5,000 and $4,250
under its ongoing share repurchase program, respectively.
In 2013, 2012 and 2011, “Net sales (purchases) of other
short-term investments” generally consisted of restricted cash
associated with tax payments, upstream abandonment activi-
ties, funds held in escrow for asset acquisitions and capital
investment projects that was invested in cash and short-term
securities and reclassied from “Cash and cash equivalents” to
“Deferred charges and other assets” on the Consolidated Bal-
ance Sheet. e company issued $374 in 2011 of tax exempt
bonds as a source of funds for U.S. renery projects, which is
included in “Proceeds from issuance of long-term debt.”
e Consolidated Statement of Cash Flows excludes
changes to the Consolidated Balance Sheet that did not aect
cash. e 2012 period excludes the eects of $800 of proceeds
to be received in future periods for the sale of an equity interest
in the Wheatstone Project, of which $82 was received in 2013.
“Capital expenditures” in the 2012 period excludes a $1,850
increase in “Properties, plant and equipment” related to an
upstream asset exchange in Australia. Refer also to Note 24,
on page 64, for a discussion of revisions to the company’s
AROs that also did not involve cash receipts or payments for the
three years ending December 31, 2013.
Note 3 Noncontrolling Interests
Notes to the Consolidated Financial Statements
Millions of dollars, except per-share amounts