Chevron 2013 Annual Report Download - page 29
Download and view the complete annual report
Please find page 29 of the 2013 Chevron annual report below. You can navigate through the pages in the report by either clicking on the pages listed below, or by using the keyword search tool below to find specific information within the annual report.-
 1
1 -
2
-
3
-
4
-
5
-
6
-
7
-
8
-
9
-
10
-
11
-
12
-
13
-
14
-
15
-
16
-
17
-
18
-
 19
19 -
 20
20 -
 21
21 -
 22
22 -
 23
23 -
 24
24 -
 25
25 -
 26
26 -
 27
27 -
 28
28 -
 29
29 -
 30
30 -
 31
31 -
 32
32 -
 33
33 -
 34
34 -
 35
35 -
 36
36 -
 37
37 -
 38
38 -
 39
39 -
40
-
41
-
42
-
43
-
44
-
45
-
46
-
47
-
48
-
49
-
50
-
51
-
52
-
53
-
54
-
55
-
56
-
57
-
58
-
59
-
60
-
61
-
62
-
63
-
64
-
65
-
66
-
67
-
68
-
69
-
70
-
71
-
72
-
73
-
74
-
75
-
76
-
77
-
78
-
79
-
80
-
81
-
82
-
83
-
84
-
85
-
86
-
87
-
88
 |
 |

Chevron Corporation 2013 Annual Report 27
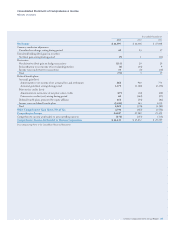
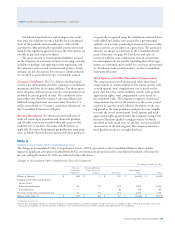
Quarterly Results and Stock Market Data
Unaudited
2013 2012
Millions of dollars, except per-share amounts 4th Q 3rd Q 2nd Q 1st Q 4th Q 3rd Q 2nd Q 1st Q
Revenues and Other Income
Sales and other operating revenues1 $ 53,950 $ 56,603 $ 55,307 $ 54,296 $ 56,254 $ 55,660 $ 59,780 $ 58,896
Income from equity affiliates 1,824 1,635 1,784 2,284 1,815 1,274 2,091 1,709
Other income 384 265 278 238 2,483 1,110 737 100
Total Revenues and Other Income 56,158 58,503 57,369 56,818 60,552 58,044 62,608 60,705
Costs and Other Deductions
Purchased crude oil and products 32,691 34,822 34,273 32,910 33,959 33,982 36,772 36,053
Operating expenses 6,521 6,066 6,278 5,762 6,273 5,694 5,420 5,183
Selling, general and administrative expenses 1,176 1,197 1,139 998 1,182 1,352 1,250 940
Exploration expenses 726 559 329 247 357 475 493 403
Depreciation, depletion and amortization 3,635 3,658 3,412 3,481 3,554 3,370 3,284 3,205
Taxes other than on income1 3,211 3,366 3,349 3,137 3,251 3,239 3,034 2,852
Total Costs and Other Deductions 47,960 49,668 48,780 46,535 48,576 48,112 50,253 48,636
Income Before Income Tax Expense 8,198 8,835 8,589 10,283 11,976 9,932 12,355 12,069
Income Tax Expense 3,240 3,839 3,185 4,044 4,679 4,624 5,123 5,570
Net Income $ 4,958 $ 4,996 $ 5,404 $ 6,239 $ 7,297 $ 5,308 $ 7,232 $ 6,499
Less: Net income attributable to
noncontrolling interests 28 46 39 61 52 55 22 28
Net Income Attributable to Chevron Corporation $ 4,930 $ 4,950 $ 5,365 $ 6,178 $ 7,245 $ 5,253 $ 7,210 $ 6,471
Per Share of Common Stock
Net Income Attributable to Chevron Corporation
Basic $ 2.60 $ 2.58 $ 2.80 $ 3.20 $ 3.73 $ 2.71 $ 3.68 $ 3.30
Diluted $ 2.57 $ 2.57 $ 2.77 $ 3.18 $ 3.70 $ 2.69 $ 3.66 $ 3.27
Dividends $ 1.00 $ 1.00 $ 1.00 $ 0.90 $ 0.90 $ 0.90 $ 0.90 $ 0.81
Common Stock Price Range – High2 $ 125.65 $ 127.83 $ 127.40 $ 121.56 $ 118.38 $ 118.53 $ 108.79 $ 112.28
Low2 $ 114.44 $ 117.22 $ 114.12 $ 108.74 $ 100.66 $ 103.29 $ 95.73 $ 102.08
1 Includes excise, value-added and similar taxes: $ 2,128 $ 2,223 $ 2,108 $ 2,033 $ 2,131 $ 2,163 $ 1,929 $ 1,787
2 Intraday price.
e company’s common stock is listed on the New York Stock Exchange (trading symbol: CVX). As of February 10, 2014,
stockholders of record numbered approximately 160,000. ere are no restrictions on the company’s ability to pay dividends.