Chevron 2013 Annual Report Download - page 17
Download and view the complete annual report
Please find page 17 of the 2013 Chevron annual report below. You can navigate through the pages in the report by either clicking on the pages listed below, or by using the keyword search tool below to find specific information within the annual report.-
 1
1 -
2
-
3
-
4
-
5
-
6
-
 7
7 -
 8
8 -
 9
9 -
 10
10 -
 11
11 -
 12
12 -
 13
13 -
 14
14 -
 15
15 -
 16
16 -
 17
17 -
 18
18 -
 19
19 -
 20
20 -
 21
21 -
 22
22 -
 23
23 -
 24
24 -
 25
25 -
 26
26 -
 27
27 -
28
-
29
-
30
-
31
-
32
-
33
-
34
-
35
-
36
-
37
-
38
-
39
-
40
-
41
-
42
-
43
-
44
-
45
-
46
-
47
-
48
-
49
-
50
-
51
-
52
-
53
-
54
-
55
-
56
-
57
-
58
-
59
-
60
-
61
-
62
-
63
-
64
-
65
-
66
-
67
-
68
-
69
-
70
-
71
-
72
-
73
-
74
-
75
-
76
-
77
-
78
-
79
-
80
-
81
-
82
-
83
-
84
-
85
-
86
-
87
-
88
 |
 |

Chevron Corporation 2013 Annual Report 15
International Upstream
Millions of dollars 2013 2012 2011
Earnings* $ 16,765 $ 18,456 $ 18,274
*Includes foreign currency eects: $ 559 $ (275) $ 211
International upstream earnings were $16.8 billion
in 2013 compared with $18.5 billion in 2012. e
decrease was mainly due to the absence of 2012 gains of
approximately $1.4 billion on an asset exchange in Australia
and $600 million on the sale of an equity interest in the
Wheatstone Project, lower crude oil prices of $500 million,
and higher operating expenses of $400 million. Partially
osetting these eects were lower income tax expenses of
$430 million. Foreign currency eects increased earnings
by $559 million in 2013, compared with a decrease of
$275 million a year earlier.
International upstream earnings were $18.5 billion in
2012 compared with $18.3 billion in 2011. e increase was
mainly due to the gain of approximately $1.4 billion on an
asset exchange in Australia, higher natural gas realizations of
about $610 million and the nearly $600 million gain on sale
of an equity interest in the Wheatstone Project. Mostly
osetting these eects were lower crude oil volumes of
$1.3 billion and higher exploration expenses of $430 million.
Foreign currency eects decreased earnings by $275 million
in 2012, compared with an increase of $211 million a year
earlier.
e company’s average realization for international crude
oil and natural gas liquids in 2013 was $100.26 per barrel,
compared with $101.88 in 2012 and $101.53 in 2011. e
average natural gas realization was $5.91 per thousand cubic
feet in 2013, compared with $5.99 and $5.39 in 2012 and
2011, respectively.
International net oil-equivalent production of 1.94 mil-
lion barrels per day in 2013 decreased 1 percent from 2012
and decreased 3 percent from 2011. Project ramp-ups in Nige-
ria and Angola in 2013 were more than oset by normal eld
declines. e decline between 2012 and 2011 was a result of
new production in ailand and Nigeria in 2012 being more
than oset by normal eld declines, the shut-in of the Frade
Field in Brazil and a major planned turnaround at
Tengizchevroil.
e net liquids component of international oil-equivalent
production was 1.3 million barrels per day in 2013, a decrease
of approximately 2 percent from 2012 and a decrease of
approximately 7 percent from 2011. International net natural
gas production of 3.9 billion cubic feet per day in 2013 was
up 2 percent from 2012 and up 8 percent from 2011.
Refer to the “Selected Operating Data” table, on page
18, for a three-year comparative of international production
volumes.
U.S. Downstream
Millions of dollars 2013 2012 2011
Earnings $ 787 $ 2,048 $ 1,506
U.S. downstream operations earned $787 million in 2013,
compared with $2.0 billion in 2012. e decrease was mainly
due to lower margins on rened product sales of $860 million
and higher operating expenses of $600 million reecting
repair and maintenance activities at the company’s reneries.
e decrease was partially oset by higher earnings of
$150 million from the 50 percent-owned CPChem.
U.S. downstream operations earned $2.0 billion in 2012,
compared with $1.5 billion in 2011. e increase was mainly
due to higher margins on rened product sales of $520 mil-
lion and higher earnings of $140 million from CPChem.
ese benets were partly oset by higher operating expenses
of $130 million.
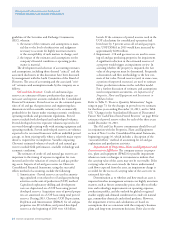
0
2000
1600
1200
800
400
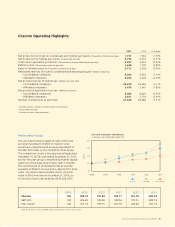
Exploration Expenses
Millions of dollars (B/T)
United States
International
Exploration expenses increased
8 percent from 2012 mainly due
to higher dry hole expense in
the U.S.
1009 11 12 13
$1,861
0.0
28.0
14.0
21.0
7.0
Worldwide Upstream Earnings
Billions of dollars
Earnings decreased in 2013 mainly
due to lower crude oil production
volume and prices, higher
operating expenses, and lower
gains on asset sales.
United States
International
1009 11 12 13
$20.8