Chevron 2013 Annual Report Download - page 53
Download and view the complete annual report
Please find page 53 of the 2013 Chevron annual report below. You can navigate through the pages in the report by either clicking on the pages listed below, or by using the keyword search tool below to find specific information within the annual report.-
 1
1 -
2
-
3
-
4
-
5
-
6
-
7
-
8
-
9
-
10
-
11
-
12
-
13
-
14
-
15
-
16
-
17
-
18
-
19
-
20
-
21
-
22
-
23
-
24
-
25
-
26
-
27
-
28
-
29
-
30
-
31
-
32
-
33
-
34
-
35
-
36
-
37
-
38
-
39
-
40
-
41
-
42
-
 43
43 -
 44
44 -
 45
45 -
 46
46 -
 47
47 -
 48
48 -
 49
49 -
 50
50 -
 51
51 -
 52
52 -
 53
53 -
 54
54 -
 55
55 -
 56
56 -
 57
57 -
 58
58 -
 59
59 -
 60
60 -
 61
61 -
 62
62 -
 63
63 -
64
-
65
-
66
-
67
-
68
-
69
-
70
-
71
-
72
-
73
-
74
-
75
-
76
-
77
-
78
-
79
-
80
-
81
-
82
-
83
-
84
-
85
-
86
-
87
-
88
 |
 |

Chevron Corporation 2013 Annual Report 51
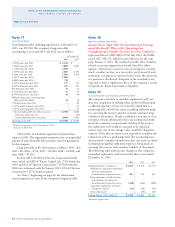
Note 15 Taxes
Note 15
Taxes
Income Taxes
Year ended December 31
2013 2012 2011
Taxes on income
U.S. federal
Current $ 15 $ 1,703 $ 1,893
Deferred 1,128 673 877
State and local
Current 120 652 596
Deferred 74 (145) 41
Total United States 1,337 2,883 3,407
International
Current 12,296 15,626 16,548
Deferred 675 1,487 671
Total International 12,971 17,113 17,219
Total taxes on income $ 14,308 $ 19,996 $ 20,626
In 2013, before-tax income for U.S. operations, including
related corporate and other charges, was $4,672, compared
with before-tax income of $8,456 and $10,222 in 2012 and
2011, respectively. For international operations, before-tax
income was $31,233, $37,876 and $37,412 in 2013, 2012
and2011, respectively. U.S. federal income tax expense was
reduced by $175, $165 and $191 in 2013, 2012 and 2011,
respectively, for business tax credits.
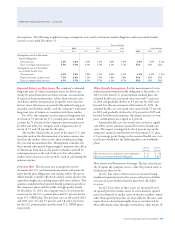
e reconciliation between the U.S. statutory federal
income tax rate and the company’s eective income tax rate
isdetailed in the following table:
Year ended December 31
2013 2012 2011
U.S. statutory federal income tax rate 35.0% 35.0% 35.0%
Eect of income taxes from inter-
national operations at rates dierent
from the U.S. statutory rate 5.1 7.8 7.5
State and local taxes on income, net
of U.S. federal income tax benet 0.6 0.6 0.9
Prior-year tax adjustments (0.8) (0.2) (0.1)
Tax credits (0.5) (0.4) (0.4)
Eects of changes in tax rates – 0.3 0.5
Other 0.5 0.1 (0.1)
Eective tax rate 39.9% 43.2% 43.3%
e company’s eective tax rate decreased from
43.2 percent in 2012 to 39.9 percent in 2013. e decrease was
primarily due to a lower eective tax rate in international
upstream operations. e lower international upstream eec-
tive tax rate was driven by a greater portion of equity income
in 2013 than in 2012 (equity income is included as part of
before-tax income and is generally recorded net of income
taxes) and foreign currency remeasurement impacts.
e company records its deferred taxes on a tax-
jurisdiction basis and classies those net amounts as current
or noncurrent based on the balance sheet classication of the
related assets or liabilities. e reported deferred tax balances
are composed of the following:
At December 31
2013 2012
Deferred tax liabilities
Properties, plant and equipment $ 25,936 $ 24,295
Investments and other 2,272 2,276
Total deferred tax liabilities 28,208 26,571
Deferred tax assets
Foreign tax credits (11,572) (10,817)
Abandonment/environmental reserves (6,279) (5,728)
Employee benets (3,825) (5,100)
Deferred credits (2,768) (2,891)
Tax loss carryforwards (1,016) (738)
Other accrued liabilities (533) (381)
Inventory (358) (281)
Miscellaneous (1,439) (1,835)
Total deferred tax assets (27,790) (27,771)
Deferred tax assets valuation allowance 17,171 15,443
Total deferred taxes, net $ 17,589 $ 14,243
Deferred tax liabilities at the end of 2013 increased by
approximately $1,600 from year-end 2012. e increase was
related to increased temporary dierences for property, plant
and equipment. Deferred tax assets were essentially
unchanged between periods.
e overall valuation allowance relates to deferred tax
assets for U.S. foreign tax credit carryforwards, tax loss carry-
forwards and temporary dierences. It reduces the deferred
tax assets to amounts that are, in management’s assessment,
more likely than not to be realized. At the end of 2013, the
company had tax loss carryforwards of approximately $3,064
and tax credit carryforwards of approximately $1,301 primar-
ily related to various international tax jurisdictions. Whereas
some of these tax loss carryforwards do not have an expira-
tion date, others expire at various times from 2014 through
2029. U.S. foreign tax credit carryforwards of $11,572 will
expire between 2014 and 2023.