Chevron 2013 Annual Report Download - page 68
Download and view the complete annual report
Please find page 68 of the 2013 Chevron annual report below. You can navigate through the pages in the report by either clicking on the pages listed below, or by using the keyword search tool below to find specific information within the annual report.-
 1
1 -
2
-
3
-
4
-
5
-
6
-
7
-
8
-
9
-
10
-
11
-
12
-
13
-
14
-
15
-
16
-
17
-
18
-
19
-
20
-
21
-
22
-
23
-
24
-
25
-
26
-
27
-
28
-
29
-
30
-
31
-
32
-
33
-
34
-
35
-
36
-
37
-
38
-
39
-
40
-
41
-
42
-
43
-
44
-
45
-
46
-
47
-
48
-
49
-
50
-
51
-
52
-
53
-
54
-
55
-
56
-
57
-
 58
58 -
 59
59 -
 60
60 -
 61
61 -
 62
62 -
 63
63 -
 64
64 -
 65
65 -
 66
66 -
 67
67 -
 68
68 -
 69
69 -
 70
70 -
 71
71 -
 72
72 -
 73
73 -
 74
74 -
 75
75 -
 76
76 -
 77
77 -
 78
78 -
79
-
80
-
81
-
82
-
83
-
84
-
85
-
86
-
87
-
88
 |
 |

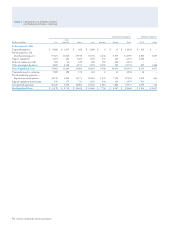
66 Chevron Corporation 2013 Annual Report
Five-Year Financial Summary
Unaudited
Millions of dollars, except per-share amounts 2013 2012 2011 2010 2009
Statement of Income Data
Revenues and Other Income
Total sales and other operating revenues* $ 220,156 $ 230,590 $ 244,371 $ 198,198 $ 167,402
Income from equity aliates and other income 8,692 11,319 9,335 6,730 4,234
Total Revenues and Other Income 228,848 241,909 253,706 204,928 171,636
Total Costs and Other Deductions 192,943 195,577 206,072 172,873 153,108
Income Before Income Tax Expense 35,905 46,332 47,634 32,055 18,528
Income Tax Expense 14,308 19,996 20,626 12,919 7,965
Net Income 21,597 26,336 27,008 19,136 10,563
Less: Net income attributable to noncontrolling interests 174 157 113 112 80
Net Income Attributable to Chevron Corporation $ 21,423 $ 26,179 $ 26,895 $ 19,024 $ 10,483
Per Share of Common Stock
Net Income Attributable to Chevron
– Basic $ 11.18 $ 13.42 $ 13.54 $ 9.53 $ 5.26
– Diluted $ 11.09 $ 13.32 $ 13.44 $ 9.48 $ 5.24
Cash Dividends Per Share $ 3.90 $ 3.51 $ 3.09 $ 2.84 $ 2.66
Balance Sheet Data (at December 31)
Current assets $ 50,250 $ 55,720 $ 53,234 $ 48,841 $ 37,216
Noncurrent assets 203,503 177,262 156,240 135,928 127,405
Total Assets 253,753 232,982 209,474 184,769 164,621
Short-term debt 374 127 340 187 384
Other current liabilities 32,644 34,085 33,260 28,825 25,827
Long-term debt and capital lease obligations 20,057 12,065 9,812 11,289 10,130
Other noncurrent liabilities 50,251 48,873 43,881 38,657 35,719
Total Liabilities 103,326 95,150 87,293 78,958 72,060
Total Chevron Corporation Stockholders’ Equity $ 149,113 $ 136,524 $ 121,382 $ 105,081 $ 91,914
Noncontrolling interests 1,314 1,308 799 730 647
Total Equity $ 150,427 $ 137,832 $ 122,181 $ 105,811 $ 92,561
*Includes excise, value-added and similar taxes: $ 8,492 $ 8,010 $ 8,085 $ 8,591 $ 8,109