Chevron 2013 Annual Report Download - page 80
Download and view the complete annual report
Please find page 80 of the 2013 Chevron annual report below. You can navigate through the pages in the report by either clicking on the pages listed below, or by using the keyword search tool below to find specific information within the annual report.-
 1
1 -
2
-
3
-
4
-
5
-
6
-
7
-
8
-
9
-
10
-
11
-
12
-
13
-
14
-
15
-
16
-
17
-
18
-
19
-
20
-
21
-
22
-
23
-
24
-
25
-
26
-
27
-
28
-
29
-
30
-
31
-
32
-
33
-
34
-
35
-
36
-
37
-
38
-
39
-
40
-
41
-
42
-
43
-
44
-
45
-
46
-
47
-
48
-
49
-
50
-
51
-
52
-
53
-
54
-
55
-
56
-
57
-
58
-
59
-
60
-
61
-
62
-
63
-
64
-
65
-
66
-
67
-
68
-
69
-
 70
70 -
 71
71 -
 72
72 -
 73
73 -
 74
74 -
 75
75 -
 76
76 -
 77
77 -
 78
78 -
 79
79 -
 80
80 -
 81
81 -
 82
82 -
 83
83 -
 84
84 -
 85
85 -
 86
86 -
 87
87 -
 88
88
 |
 |

78 Chevron Corporation 2013 Annual Report
Extensions and Discoveries In 2011, extensions and
discoveries increased reserves 4,680 BCF. In Australia, the
Wheatstone Project accounted for the 4,035 BCF in addi-
tions. In Africa, the start of a new natural gas development
project in Nigeria resulted in the 290 BCF increase. In the
United States, development drilling accounted for the major-
ity of the 287 BCF increase.
In 2012, extensions and discoveries increased reserves by
1,011 BCF. e increase of 747 BCF in Australia was primarily
related to positive drilling results at the Gorgon Project.
In 2013, extensions and discoveries increased reserves by
1,021 BCF, with the majority in the Appalachian region in
the U.S.
Purchases In 2011, purchases increased reserves
1,233 BCF. In the United States, acquisitions in the
Marcellus Shale increased reserves 1,230 BCF.
Sales In 2011, sales decreased reserves 174 BCF. In
Australia, the Wheatstone Project unitization and equity sales
agreements reduced reserves 77 BCF. In the United States,
sales in Alaska and other smaller elds reduced reserves
95 BCF.
In 2012, sales decreased reserves by 538 BCF. Sales of a
portion of the company’s equity interest in the Wheatstone
Project were responsible for the 439 BCF reserves reduction
in Australia.
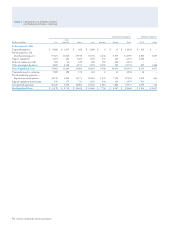
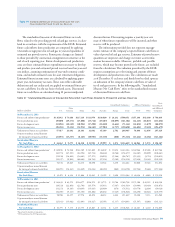
Table V Reserve Quantity Information – Continued
Noteworthy amounts in the categories of natural gas
proved-reserve changes for 2011 through 2013 are dis-
cussed below:
Revisions In 2011, net revisions increased reserves 497
BCF. For consolidated companies, improved reservoir perfor-
mance accounted for a majority of the 217 BCF increase in the
United States. In Asia, a net increase of 196 BCF was driven
by development drilling and improved eld performance in
ailand, partially oset by the eects of higher prices on
entitlement volumes in Kazakhstan. For aliated companies,
ongoing reservoir assessment resulted in the recognition of addi-
tional reserves related to the Angola LNG project. At TCO,
improved facility and reservoir performance was more than
oset by the price eect on entitlement volumes.
In 2012, net revisions increased reserves 1,855 BCF. A
net increase of 1,007 BCF in Asia was primarily due to devel-
opment drilling and additional compression in Bangladesh,
and drilling results and improved eld performance in
ailand. In Australia, updated reservoir data interpretation
based on additional drilling at the Gorgon Project drove
the 358 BCF increase. Drilling results from activities in
the Marcellus Shale were responsible for the majority of the
318 BCF increase in the United States.
In 2013, net revisions increased reserves 718 BCF.
A net increase of 627 BCF in Asia was primarily due to
development drilling and improved eld performance in
Bangladesh and ailand. In Australia, drilling performance
drove the 229 BCF increase. e majority of the net decrease
of 234 BCF in the United States was due to a change in
development plans in the Appalachian region.