Virgin Media 2006 Annual Report Download - page 73
Download and view the complete annual report
Please find page 73 of the 2006 Virgin Media annual report below. You can navigate through the pages in the report by either clicking on the pages listed below, or by using the keyword search tool below to find specific information within the annual report.-
 1
1 -
2
-
3
-
4
-
5
-
6
-
7
-
8
-
9
-
10
-
11
-
12
-
13
-
14
-
15
-
16
-
17
-
18
-
19
-
20
-
21
-
22
-
23
-
24
-
25
-
26
-
27
-
28
-
29
-
30
-
31
-
32
-
33
-
34
-
35
-
36
-
37
-
38
-
39
-
40
-
41
-
42
-
43
-
44
-
45
-
46
-
47
-
48
-
49
-
50
-
51
-
52
-
53
-
54
-
55
-
56
-
57
-
58
-
59
-
60
-
61
-
62
-
 63
63 -
 64
64 -
 65
65 -
 66
66 -
 67
67 -
 68
68 -
 69
69 -
 70
70 -
 71
71 -
 72
72 -
 73
73 -
 74
74 -
 75
75 -
 76
76 -
 77
77 -
 78
78 -
 79
79 -
 80
80 -
 81
81 -
 82
82 -
 83
83 -
84
-
85
-
86
-
87
-
88
-
89
-
90
-
91
-
92
-
93
-
94
-
95
-
96
-
97
-
98
-
99
-
100
-
101
-
102
-
103
-
104
-
105
-
106
-
107
-
108
-
109
-
110
-
111
-
112
-
113
-
114
-
115
-
116
-
117
-
118
-
119
-
120
-
121
-
122
-
123
-
124
-
125
-
126
-
127
-
128
-
129
-
130
-
131
-
132
-
133
-
134
-
135
-
136
-
137
-
138
-
139
-
140
-
141
-
142
-
143
-
144
-
145
-
146
-
147
-
148
-
149
-
150
-
151
-
152
-
153
-
154
-
155
-
156
-
157
-
158
-
159
-
160
-
161
-
162
-
163
-
164
-
165
-
166
-
167
-
168
-
169
-
170
-
171
-
172
-
173
-
174
-
175
-
176
-
177
-
178
-
179
-
180
-
181
-
182
-
183
-
184
-
185
-
186
-
187
-
188
-
189
-
190
-
191
-
192
-
193
-
194
-
195
-
196
-
197
-
198
-
199
-
200
-
201
-
202
-
203
-
204
-
205
-
206
-
207
-
208
-
209
-
210
-
211
-
212
-
213
-
214
-
215
-
216
-
217
-
218
-
219
-
220
-
221
-
222
-
223
-
224
-
225
-
226
-
227
-
228
-
229
-
230
-
231
-
232
-
233
-
234
-
235
-
236
-
237
-
238
-
239
-
240
-
241
-
242
-
243
-
244
-
245
-
246
-
247
-
248
-
249
-
250
-
251
-
252
-
253
-
254
-
255
-
256
-
257
-
258
-
259
-
260
-
261
-
262
-
263
-
264
-
265
-
266
-
267
-
268
-
269
-
270
-
271
-
272
-
273
-
274
-
275
-
276
 |
 |

• enter into sale and leaseback transactions or certain vendor financing arrangements;
• create liens;
• enter into agreements that restrict the restricted subsidiaries’ ability to pay dividends, transfer assets or make intercompany
loans;
• merge or consolidate or transfer all or substantially all of their assets; and
• enter into transactions with affiliates.
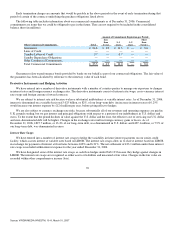
Debt Ratings
To access public debt capital markets, we rely on credit rating agencies to assign corporate credit ratings. A rating is not a
recommendation by the rating agency to buy, sell or hold our securities. A credit rating agency may change or withdraw our ratings
based on its assessment of our current and future ability to meet interest and principal repayment obligations. Lower credit ratings
generally result in higher borrowing costs and reduced access to debt capital markets. The corporate debt ratings and outlook currently
assigned by the rating agencies engaged by us are as follows:
Corporate
Rating Outlook
Moody’s Investors Service Inc. Ba3 Stable
Standard & Poor’s B+ Positive
Cash Dividends
On May 18, 2006, August 28, 2006 and November 28, 2006, our board of directors approved and declared the payment of regular
quarterly cash dividends of $0.01, $0.02 and $0.02 per share on June 20, 2006, September 20, 2006 and December 20, 2006, to
stockholders of record as of June 12, 2006, September 12, 2006, and December 12, 2006, totaling £1.6 million, £3.5 million and £3.4
million, respectively. Future payments of regular quarterly dividends by us are at the discretion of the board of directors and will be
subject to our future needs and uses of free cash flow, which could include investments in operations, the repayment of debt, and share
repurchase programs.
Off−Balance Sheet Arrangements
As of December 31, 2006, we had no off−balance sheet arrangements.
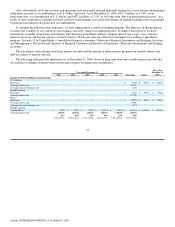
Contractual Obligations and Commercial Commitments
The following table includes aggregate information about our contractual obligations as of December 31, 2006, and the periods in
which payments are due (in millions).
Payments Due by Period
Contractual Obligations Total Less than
1 year 1−3
years 3−5
years More than
5 years
Long−Term Debt Obligations £ 6,054.7 £127.5 £ 1,215.2 £ 2,074.5 £ 2,637.5
Capital Lease Obligations 188.7 29.9 37.9 29.3 91.6
Operating Lease Obligations 394.8 53.1 86.3 69.6 185.8
Purchase Obligations 605.1 284.9 169.2 101.7 49.3
Interest Obligations 2,262.4 462.9 840.9 571.2 387.4
Total £ 9,505.7 £ 958.3 £ 2,349.5 £ 2,846.3 £ 3,351.6
Early termination charges £ 36.0 £ 53.2 £ 28.2 £ 14.2
69
Source: VIRGIN MEDIA INVESTM, 10−K, March 01, 2007