Virgin Media 2006 Annual Report Download - page 172
Download and view the complete annual report
Please find page 172 of the 2006 Virgin Media annual report below. You can navigate through the pages in the report by either clicking on the pages listed below, or by using the keyword search tool below to find specific information within the annual report.-
 1
1 -
2
-
3
-
4
-
5
-
6
-
7
-
8
-
9
-
10
-
11
-
12
-
13
-
14
-
15
-
16
-
17
-
18
-
19
-
20
-
21
-
22
-
23
-
24
-
25
-
26
-
27
-
28
-
29
-
30
-
31
-
32
-
33
-
34
-
35
-
36
-
37
-
38
-
39
-
40
-
41
-
42
-
43
-
44
-
45
-
46
-
47
-
48
-
49
-
50
-
51
-
52
-
53
-
54
-
55
-
56
-
57
-
58
-
59
-
60
-
61
-
62
-
63
-
64
-
65
-
66
-
67
-
68
-
69
-
70
-
71
-
72
-
73
-
74
-
75
-
76
-
77
-
78
-
79
-
80
-
81
-
82
-
83
-
84
-
85
-
86
-
87
-
88
-
89
-
90
-
91
-
92
-
93
-
94
-
95
-
96
-
97
-
98
-
99
-
100
-
101
-
102
-
103
-
104
-
105
-
106
-
107
-
108
-
109
-
110
-
111
-
112
-
113
-
114
-
115
-
116
-
117
-
118
-
119
-
120
-
121
-
122
-
123
-
124
-
125
-
126
-
127
-
128
-
129
-
130
-
131
-
132
-
133
-
134
-
135
-
136
-
137
-
138
-
139
-
140
-
141
-
142
-
143
-
144
-
145
-
146
-
147
-
148
-
149
-
150
-
151
-
152
-
153
-
154
-
155
-
156
-
157
-
158
-
159
-
160
-
161
-
 162
162 -
 163
163 -
 164
164 -
 165
165 -
 166
166 -
 167
167 -
 168
168 -
 169
169 -
 170
170 -
 171
171 -
 172
172 -
 173
173 -
 174
174 -
 175
175 -
 176
176 -
 177
177 -
 178
178 -
 179
179 -
 180
180 -
 181
181 -
 182
182 -
183
-
184
-
185
-
186
-
187
-
188
-
189
-
190
-
191
-
192
-
193
-
194
-
195
-
196
-
197
-
198
-
199
-
200
-
201
-
202
-
203
-
204
-
205
-
206
-
207
-
208
-
209
-
210
-
211
-
212
-
213
-
214
-
215
-
216
-
217
-
218
-
219
-
220
-
221
-
222
-
223
-
224
-
225
-
226
-
227
-
228
-
229
-
230
-
231
-
232
-
233
-
234
-
235
-
236
-
237
-
238
-
239
-
240
-
241
-
242
-
243
-
244
-
245
-
246
-
247
-
248
-
249
-
250
-
251
-
252
-
253
-
254
-
255
-
256
-
257
-
258
-
259
-
260
-
261
-
262
-
263
-
264
-
265
-
266
-
267
-
268
-
269
-
270
-
271
-
272
-
273
-
274
-
275
-
276
 |
 |

VIRGIN MEDIA INVESTMENT HOLDINGS LIMITED AND SUBSIDIARIES
NOTES TO CONSOLIDATED FINANCIAL STATEMENTS (Continued)
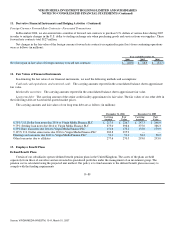
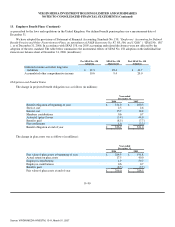
13. Employee Benefit Plans (Continued)
Plan Assets
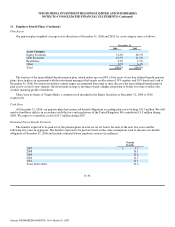
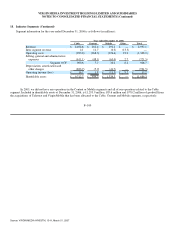
Our pension plan weighted−average assets allocations at December 31, 2006 and 2005, by asset category were as follows:
December 31,
2006 2005
Asset Category
Equity Securities 51.2% 48.5%
Debt Securities 43.5% 43.2%
Real Estate 2.3% 1.9%
Other 3.0% 6.4%
Total 100.0% 100.0%
The trustees of the main defined benefit pension plan, which makes up over 86% of the assets of our four defined benefit pension
plans, have in place an agreement with the investment managers that targets an allocation of 50% equities and 50% bonds and cash at
December 31, 2006. Deviations from these central targets are permitted from time to time. Because the main defined benefit pension
plan is now closed to new entrants, the investment strategy is moving towards a higher proportion of bonds over time to reflect the
steadily maturing profile of liabilities.
There were no shares of Virgin Media’s common stock included in the Equity Securities at December 31, 2006 or 2005,
respectively.
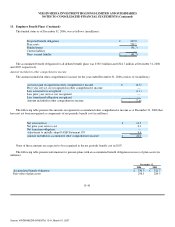
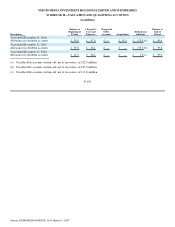
Cash flows
At December 31, 2006, our pension plans have projected benefit obligations exceeding plan assets totaling £41.7 million. We will
need to fund these deficits in accordance with the laws and regulations of the United Kingdom. We contributed £1.8 million during
2006. We expect to contribute a total of £9.3 million during 2007.
Estimated Future Benefit Payments
The benefits expected to be paid out of the pension plans in total are set out below for each of the next five years and the
following five years in aggregate. The benefits expected to be paid are based on the same assumptions used to measure our benefit
obligation at December 31, 2006 and include estimated future employee services (in millions):
Pension
Benefits
2007 £ 9.3
2008 10.1
2009 10.8
2010 11.7
2011 12.5
Years 2012−2016 79.3
F−93
Source: VIRGIN MEDIA INVESTM, 10−K, March 01, 2007