Virgin Media 2006 Annual Report Download - page 45
Download and view the complete annual report
Please find page 45 of the 2006 Virgin Media annual report below. You can navigate through the pages in the report by either clicking on the pages listed below, or by using the keyword search tool below to find specific information within the annual report.-
 1
1 -
2
-
3
-
4
-
5
-
6
-
7
-
8
-
9
-
10
-
11
-
12
-
13
-
14
-
15
-
16
-
17
-
18
-
19
-
20
-
21
-
22
-
23
-
24
-
25
-
26
-
27
-
28
-
29
-
30
-
31
-
32
-
33
-
34
-
 35
35 -
 36
36 -
 37
37 -
 38
38 -
 39
39 -
 40
40 -
 41
41 -
 42
42 -
 43
43 -
 44
44 -
 45
45 -
 46
46 -
 47
47 -
 48
48 -
 49
49 -
 50
50 -
 51
51 -
 52
52 -
 53
53 -
 54
54 -
 55
55 -
56
-
57
-
58
-
59
-
60
-
61
-
62
-
63
-
64
-
65
-
66
-
67
-
68
-
69
-
70
-
71
-
72
-
73
-
74
-
75
-
76
-
77
-
78
-
79
-
80
-
81
-
82
-
83
-
84
-
85
-
86
-
87
-
88
-
89
-
90
-
91
-
92
-
93
-
94
-
95
-
96
-
97
-
98
-
99
-
100
-
101
-
102
-
103
-
104
-
105
-
106
-
107
-
108
-
109
-
110
-
111
-
112
-
113
-
114
-
115
-
116
-
117
-
118
-
119
-
120
-
121
-
122
-
123
-
124
-
125
-
126
-
127
-
128
-
129
-
130
-
131
-
132
-
133
-
134
-
135
-
136
-
137
-
138
-
139
-
140
-
141
-
142
-
143
-
144
-
145
-
146
-
147
-
148
-
149
-
150
-
151
-
152
-
153
-
154
-
155
-
156
-
157
-
158
-
159
-
160
-
161
-
162
-
163
-
164
-
165
-
166
-
167
-
168
-
169
-
170
-
171
-
172
-
173
-
174
-
175
-
176
-
177
-
178
-
179
-
180
-
181
-
182
-
183
-
184
-
185
-
186
-
187
-
188
-
189
-
190
-
191
-
192
-
193
-
194
-
195
-
196
-
197
-
198
-
199
-
200
-
201
-
202
-
203
-
204
-
205
-
206
-
207
-
208
-
209
-
210
-
211
-
212
-
213
-
214
-
215
-
216
-
217
-
218
-
219
-
220
-
221
-
222
-
223
-
224
-
225
-
226
-
227
-
228
-
229
-
230
-
231
-
232
-
233
-
234
-
235
-
236
-
237
-
238
-
239
-
240
-
241
-
242
-
243
-
244
-
245
-
246
-
247
-
248
-
249
-
250
-
251
-
252
-
253
-
254
-
255
-
256
-
257
-
258
-
259
-
260
-
261
-
262
-
263
-
264
-
265
-
266
-
267
-
268
-
269
-
270
-
271
-
272
-
273
-
274
-
275
-
276
 |
 |

PART II
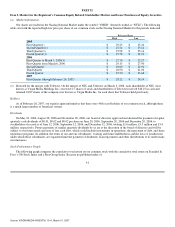
Item 5. Market for the Registrant’s Common Equity Related Stockholder Matters and Issuer Purchases of Equity Securities
(a) Market Information
Our shares are traded on the Nasdaq National Market under the symbol “VMED” (formerly traded as “NTLI”). The following
table sets forth the reported high low price per share of our common stock on the Nasdaq National Market for the periods indicated.
Price per Share
High Low
2005
First Quarter(1) $ 29.25 $ 25.24
Second Quarter(1) $ 27.71 $ 25.14
Third Quarter(1) $ 27.98 $ 25.14
Fourth Quarter(1) $ 27.78 $ 22.21
2006
First Quarter to March 3, 2006(1) $ 27.76 $ 25.27
First Quarter from March 6, 2006 $ 29.15 $ 27.00
Second Quarter $ 29.69 $ 22.91
Third Quarter $ 26.90 $ 21.02
Fourth Quarter $ 27.50 $ 23.68
2007
First Quarter (through February 26, 2007) $ 28.22 $ 24.14
(1) Restated for the merger with Telewest. On the merger of NTL and Telewest on March 3, 2006, each shareholder of NTL (now
known as Virgin Media Holdings Inc.) received 2.5 shares of stock and shareholders of Telewest received $16.25 in cash and
retained 0.287 shares of the company now known as Virgin Media Inc. for each share that Telewest held previously.
Holders
As of February 26, 2007, our transfer agent informed us that there were 468 record holders of our common stock, although there
is a much larger number of beneficial owners.
Dividends
On May 18, 2006, August 28, 2006 and November 28, 2006, our board of directors approved and declared the payment of regular
quarterly cash dividends of $0.01, $0.02 and $0.02 per share on June 20, 2006, September 20, 2006 and December 20, 2006, to
stockholders of record as of June 12, 2006, September 12, 2006, and December 12, 2006, totaling £1.6 million, £3.5 million and £3.4
million, respectively. Future payments of regular quarterly dividends by us are at the discretion of the board of directors and will be
subject to our future needs and uses of free cash flow, which could include investments in operations, the repayment of debt, and share
repurchase programs. In addition, the terms of our and our subsidiaries’ existing and future indebtedness and the laws of jurisdictions
under which those subsidiaries are organized limit the payment of dividends, loan repayments and other distributions to us under many
circumstances.
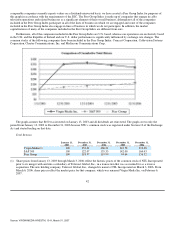
Stock Performance Graph
The following graph compares the cumulative total return on our common stock with the cumulative total return on Standard &
Poor’s 500 Stock Index and a Peer Group Index. Because no published index of
41
Source: VIRGIN MEDIA INVESTM, 10−K, March 01, 2007