Virgin Media 2006 Annual Report Download - page 145
Download and view the complete annual report
Please find page 145 of the 2006 Virgin Media annual report below. You can navigate through the pages in the report by either clicking on the pages listed below, or by using the keyword search tool below to find specific information within the annual report.-
 1
1 -
2
-
3
-
4
-
5
-
6
-
7
-
8
-
9
-
10
-
11
-
12
-
13
-
14
-
15
-
16
-
17
-
18
-
19
-
20
-
21
-
22
-
23
-
24
-
25
-
26
-
27
-
28
-
29
-
30
-
31
-
32
-
33
-
34
-
35
-
36
-
37
-
38
-
39
-
40
-
41
-
42
-
43
-
44
-
45
-
46
-
47
-
48
-
49
-
50
-
51
-
52
-
53
-
54
-
55
-
56
-
57
-
58
-
59
-
60
-
61
-
62
-
63
-
64
-
65
-
66
-
67
-
68
-
69
-
70
-
71
-
72
-
73
-
74
-
75
-
76
-
77
-
78
-
79
-
80
-
81
-
82
-
83
-
84
-
85
-
86
-
87
-
88
-
89
-
90
-
91
-
92
-
93
-
94
-
95
-
96
-
97
-
98
-
99
-
100
-
101
-
102
-
103
-
104
-
105
-
106
-
107
-
108
-
109
-
110
-
111
-
112
-
113
-
114
-
115
-
116
-
117
-
118
-
119
-
120
-
121
-
122
-
123
-
124
-
125
-
126
-
127
-
128
-
129
-
130
-
131
-
132
-
133
-
134
-
 135
135 -
 136
136 -
 137
137 -
 138
138 -
 139
139 -
 140
140 -
 141
141 -
 142
142 -
 143
143 -
 144
144 -
 145
145 -
 146
146 -
 147
147 -
 148
148 -
 149
149 -
 150
150 -
 151
151 -
 152
152 -
 153
153 -
 154
154 -
 155
155 -
156
-
157
-
158
-
159
-
160
-
161
-
162
-
163
-
164
-
165
-
166
-
167
-
168
-
169
-
170
-
171
-
172
-
173
-
174
-
175
-
176
-
177
-
178
-
179
-
180
-
181
-
182
-
183
-
184
-
185
-
186
-
187
-
188
-
189
-
190
-
191
-
192
-
193
-
194
-
195
-
196
-
197
-
198
-
199
-
200
-
201
-
202
-
203
-
204
-
205
-
206
-
207
-
208
-
209
-
210
-
211
-
212
-
213
-
214
-
215
-
216
-
217
-
218
-
219
-
220
-
221
-
222
-
223
-
224
-
225
-
226
-
227
-
228
-
229
-
230
-
231
-
232
-
233
-
234
-
235
-
236
-
237
-
238
-
239
-
240
-
241
-
242
-
243
-
244
-
245
-
246
-
247
-
248
-
249
-
250
-
251
-
252
-
253
-
254
-
255
-
256
-
257
-
258
-
259
-
260
-
261
-
262
-
263
-
264
-
265
-
266
-
267
-
268
-
269
-
270
-
271
-
272
-
273
-
274
-
275
-
276
 |
 |

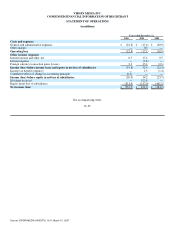
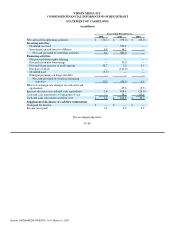
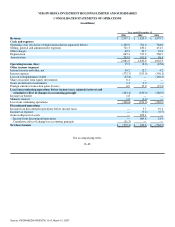
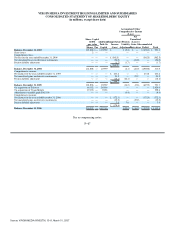
VIRGIN MEDIA INVESTMENT HOLDINGS LIMITED AND SUBSIDIARIES
CONSOLIDATED STATEMENTS OF CASH FLOWS
(in millions)
Year ended December 31,
2006 2005 2004
Operating Activities:
Net (loss) income £ (372.3) £ 433.6 £ (562.5)
Cumulative effect of changes in accounting principles 31.7 — —
Income from discontinued operations — (664.6) (18.4)
Loss from continuing operations (340.6) (231.0) (580.9)
Adjustments to reconcile net (loss) income to net cash provided by
operating activities:
Depreciation and amortization 869.3 619.1 662.8
Non−cash compensation — — (0.3)
Share of income from equity investments (5.8) — —
Deferred income taxes (3.0) — 0.4
Minority interest (1.0) 1.0 —
Loss on extinguishment of debt 32.8 — 162.2
Amortization of original issue discount and deferred finance
costs 17.2 24.2 29.3
Changes in operating assets and liabilities, net of effect from
business acquisitions and dispositions:
Accounts receivable (78.3) 17.7 (13.9)
Inventory (4.6) — —
Prepaid expenses and other current assets (13.4) 5.2 94.6
Other assets 3.3 (1.0) 7.4
Accounts payable 6.3 49.1 (19.4)
Accrued expenses and other current liabilities 231.2 (44.1) (49.0)
Other long term liabilities (14.7) (91.5) (3.9)
Net cash provided by operating activities 698.7 348.7 289.3
Investing activities
Purchase of fixed assets (484.2) (285.2) (267.4)
Purchase of intangible assets (10.0)
Investments in and loans to parent and subsidiary companies — (573.6) —
Decrease in restricted cash 1.7 12.3 —
Income from equity investments 9.3 — —
Proceeds from sale of assets 1.5 2.6 —
Acquisitions, net of cash acquired (4,410.9) — (18.5)
Proceeds from the sale of Broadcast operations, net — 1,227.8 —
Proceeds from the sale of Ireland operations, net — 216.2 —
Net cash (used in) provided by investing activities (4,892.6) 600.1 (285.9)
Financing activities
New borrowings, net of financing fees 5,168.3 — 2,925.1
Principal payments on long term debt (3,262.1) (723.2) (3,287.6)
Issuance of shares 2,420.6 — —
Capital lease payments (37.0) (4.6) (1.1)
Net cash provided by (used in) financing activities 4,289.8 (727.8) (363.6)
Cash flow from discontinued operations
Net cash (used in) provided by operating activities — (14.3) 123.8
Net cash (used in) investing activities — (4.1) (29.3)
Net cash (used in) provided by discontinued operations — (18.4) 94.5
Increase (decrease) in cash and cash equivalents 95.9 202.6 (265.7)
Cash and cash equivalents at beginning of year 288.1 85.5 351.2
Cash and cash equivalents at end of year £ 384.0 £ 288.1 £ 85.5
Supplemental disclosure of cash flow information
Cash paid during the year for interest exclusive of amounts
capitalized £ 192.9 £ 238.3 £ 300.8
Income taxes paid £4.6 — —
See accompanying notes.
F−66
Source: VIRGIN MEDIA INVESTM, 10−K, March 01, 2007