Virgin Media 2006 Annual Report Download - page 49
Download and view the complete annual report
Please find page 49 of the 2006 Virgin Media annual report below. You can navigate through the pages in the report by either clicking on the pages listed below, or by using the keyword search tool below to find specific information within the annual report.-
 1
1 -
2
-
3
-
4
-
5
-
6
-
7
-
8
-
9
-
10
-
11
-
12
-
13
-
14
-
15
-
16
-
17
-
18
-
19
-
20
-
21
-
22
-
23
-
24
-
25
-
26
-
27
-
28
-
29
-
30
-
31
-
32
-
33
-
34
-
35
-
36
-
37
-
38
-
 39
39 -
 40
40 -
 41
41 -
 42
42 -
 43
43 -
 44
44 -
 45
45 -
 46
46 -
 47
47 -
 48
48 -
 49
49 -
 50
50 -
 51
51 -
 52
52 -
 53
53 -
 54
54 -
 55
55 -
 56
56 -
 57
57 -
 58
58 -
 59
59 -
60
-
61
-
62
-
63
-
64
-
65
-
66
-
67
-
68
-
69
-
70
-
71
-
72
-
73
-
74
-
75
-
76
-
77
-
78
-
79
-
80
-
81
-
82
-
83
-
84
-
85
-
86
-
87
-
88
-
89
-
90
-
91
-
92
-
93
-
94
-
95
-
96
-
97
-
98
-
99
-
100
-
101
-
102
-
103
-
104
-
105
-
106
-
107
-
108
-
109
-
110
-
111
-
112
-
113
-
114
-
115
-
116
-
117
-
118
-
119
-
120
-
121
-
122
-
123
-
124
-
125
-
126
-
127
-
128
-
129
-
130
-
131
-
132
-
133
-
134
-
135
-
136
-
137
-
138
-
139
-
140
-
141
-
142
-
143
-
144
-
145
-
146
-
147
-
148
-
149
-
150
-
151
-
152
-
153
-
154
-
155
-
156
-
157
-
158
-
159
-
160
-
161
-
162
-
163
-
164
-
165
-
166
-
167
-
168
-
169
-
170
-
171
-
172
-
173
-
174
-
175
-
176
-
177
-
178
-
179
-
180
-
181
-
182
-
183
-
184
-
185
-
186
-
187
-
188
-
189
-
190
-
191
-
192
-
193
-
194
-
195
-
196
-
197
-
198
-
199
-
200
-
201
-
202
-
203
-
204
-
205
-
206
-
207
-
208
-
209
-
210
-
211
-
212
-
213
-
214
-
215
-
216
-
217
-
218
-
219
-
220
-
221
-
222
-
223
-
224
-
225
-
226
-
227
-
228
-
229
-
230
-
231
-
232
-
233
-
234
-
235
-
236
-
237
-
238
-
239
-
240
-
241
-
242
-
243
-
244
-
245
-
246
-
247
-
248
-
249
-
250
-
251
-
252
-
253
-
254
-
255
-
256
-
257
-
258
-
259
-
260
-
261
-
262
-
263
-
264
-
265
-
266
-
267
-
268
-
269
-
270
-
271
-
272
-
273
-
274
-
275
-
276
 |
 |
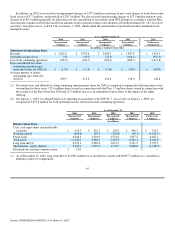
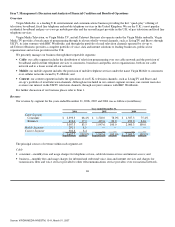
In addition, in 2002 we recorded asset impairment charges of £277.0 million consisting of non−cash charges to write down some
fixed assets of £37.3 million, and goodwill of £239.7 million. We also recorded restructuring charges of £57.9 million and non−cash
charges of £189.3 million primarily for allowances for the cancellation of receivables from NTL Europe in accordance with the Plan.
Amortization expense in 2002 decreased from amounts in prior periods owing to the adoption of FASB Statement No. 142, Goodwill
and Other Intangible Assets, or FAS 142, on January 1, 2002, which ended the amortization of goodwill and other indefinite lived
intangible assets.
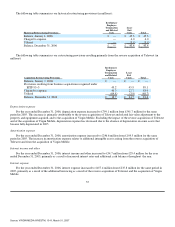
Year ended December 31,
2006 2005 2004 2003 2002
Reorganized
Company Reorganized
Company Reorganized
Company Reorganized
Company Predecessor
Company(2)
(in millions, except per share data)
Statement of Operations Data:
Revenue £ 3,602.2 £ 1,947.6 £ 2,000.3 £ 1,887.4 £ 1,854.5
Operating income (loss) 9.8 (19.7) (52.5) (194.4) (955.2)
Loss from continuing operations (509.2) (241.7) (509.4) (606.7) (1,611.6)
Basic and diluted loss from
continuing operations per
share (pro forma for 2002)(1) £ (1.74) £ (1.13) £ (2.34) £ (3.84) £ (10.83)
Average number of shares
outstanding (pro forma for
2002)(1) 292.9 213.8 218.0 158.0 148.8
(1) Pro forma basic and diluted loss from continuing operations per share for 2002 is computed assuming the following shares were
outstanding for these years: 125.0 million shares issued in connection with the Plan, 1.3 million shares issued in connection with
the issuance of the Exit Notes due 2010 and 22.5 million shares as an adjustment to give effect to the impact of the rights
offering.
(2) On January 1, 2003, we adopted fresh−start reporting in accordance with SOP 90−7. As a result, on January 1, 2003, we
recognized £3,655.8 million for both operating income and income from continuing operations.
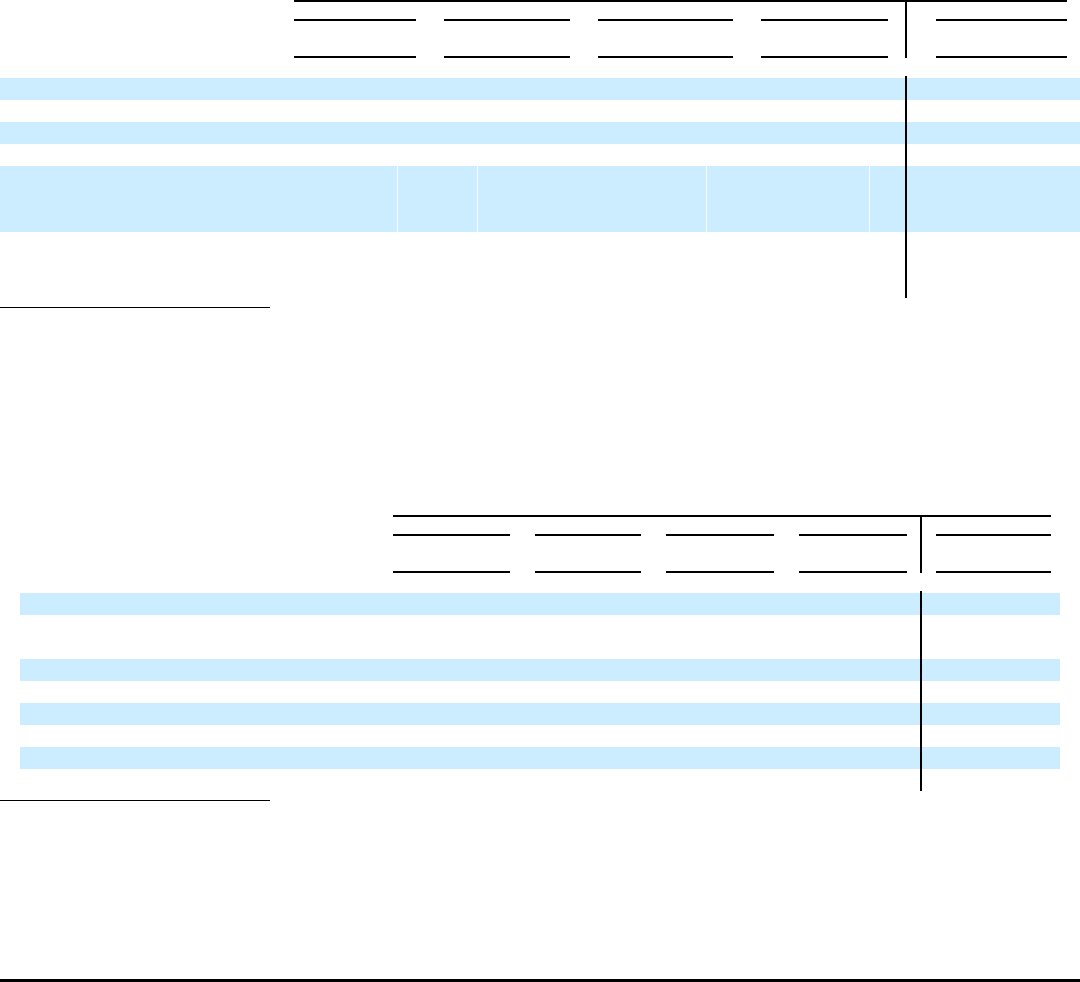
As of December 31,
2006 2005 2004 2003 2002
Reorganized
Company Reorganized
Company Reorganized
Company Reorganized
Company Predecessor
Company
(in millions)
Balance Sheet Data:
Cash, cash equivalents and marketable
securities £ 418.5 £ 832.1 £ 136.8 £ 446.1 £ 315.1
Working capital (604.4) 529.9 (286.8) (48.1) (4,224.4)
Fixed assets 6,026.3 3,294.9 3,531.6 3,857.2 6,487.1
Total assets 11,243.5 4,988.5 5,493.3 6,262.1 8,102.8
Long term debt(1) 6,159.1 2,280.0 3,013.5 3,211.9 9,795.9
Shareholders’ equity (deficit) 3,230.1 1,955.0 1,574.5 2,068.6 (3,218.9)
Dividends declared per common share £ 0.03 — — — —
(1) As of December 31, 2002, long term debt of £3,698.2 million was classified as current and £6,097.7 million was classified as
liabilities subject to compromise.
45
Source: VIRGIN MEDIA INVESTM, 10−K, March 01, 2007