Virgin Media 2006 Annual Report Download - page 63
Download and view the complete annual report
Please find page 63 of the 2006 Virgin Media annual report below. You can navigate through the pages in the report by either clicking on the pages listed below, or by using the keyword search tool below to find specific information within the annual report.-
 1
1 -
2
-
3
-
4
-
5
-
6
-
7
-
8
-
9
-
10
-
11
-
12
-
13
-
14
-
15
-
16
-
17
-
18
-
19
-
20
-
21
-
22
-
23
-
24
-
25
-
26
-
27
-
28
-
29
-
30
-
31
-
32
-
33
-
34
-
35
-
36
-
37
-
38
-
39
-
40
-
41
-
42
-
43
-
44
-
45
-
46
-
47
-
48
-
49
-
50
-
51
-
52
-
 53
53 -
 54
54 -
 55
55 -
 56
56 -
 57
57 -
 58
58 -
 59
59 -
 60
60 -
 61
61 -
 62
62 -
 63
63 -
 64
64 -
 65
65 -
 66
66 -
 67
67 -
 68
68 -
 69
69 -
 70
70 -
 71
71 -
 72
72 -
 73
73 -
74
-
75
-
76
-
77
-
78
-
79
-
80
-
81
-
82
-
83
-
84
-
85
-
86
-
87
-
88
-
89
-
90
-
91
-
92
-
93
-
94
-
95
-
96
-
97
-
98
-
99
-
100
-
101
-
102
-
103
-
104
-
105
-
106
-
107
-
108
-
109
-
110
-
111
-
112
-
113
-
114
-
115
-
116
-
117
-
118
-
119
-
120
-
121
-
122
-
123
-
124
-
125
-
126
-
127
-
128
-
129
-
130
-
131
-
132
-
133
-
134
-
135
-
136
-
137
-
138
-
139
-
140
-
141
-
142
-
143
-
144
-
145
-
146
-
147
-
148
-
149
-
150
-
151
-
152
-
153
-
154
-
155
-
156
-
157
-
158
-
159
-
160
-
161
-
162
-
163
-
164
-
165
-
166
-
167
-
168
-
169
-
170
-
171
-
172
-
173
-
174
-
175
-
176
-
177
-
178
-
179
-
180
-
181
-
182
-
183
-
184
-
185
-
186
-
187
-
188
-
189
-
190
-
191
-
192
-
193
-
194
-
195
-
196
-
197
-
198
-
199
-
200
-
201
-
202
-
203
-
204
-
205
-
206
-
207
-
208
-
209
-
210
-
211
-
212
-
213
-
214
-
215
-
216
-
217
-
218
-
219
-
220
-
221
-
222
-
223
-
224
-
225
-
226
-
227
-
228
-
229
-
230
-
231
-
232
-
233
-
234
-
235
-
236
-
237
-
238
-
239
-
240
-
241
-
242
-
243
-
244
-
245
-
246
-
247
-
248
-
249
-
250
-
251
-
252
-
253
-
254
-
255
-
256
-
257
-
258
-
259
-
260
-
261
-
262
-
263
-
264
-
265
-
266
-
267
-
268
-
269
-
270
-
271
-
272
-
273
-
274
-
275
-
276
 |
 |

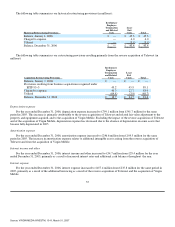
decrease is attributable to declines in telephony voice revenue and lower wholesale and other revenues, partially offset by greater data
installation and rental revenue.
Cable segment OCF
For the year ended December 31, 2006, pro forma Cable segment OCF decreased by 3.9% to £1,145.2 million from £1,191.7
million for the year ended December 31, 2005. The decrease in OCF is primarily due to increased selling, general and administrative
expenses, which included pre−acquisition charges of £20.9 million relating to the reverse acquisition of Telewest, consisting of legal
and professional charges of £11.7 million and executive compensation costs and insurance expenses of £9.2 million, together with
integration costs incurred since the acquisition.
Summary Cable Statistics
Selected statistics for residential cable customers of Virgin Media, excluding customers off our network and Virgin Mobile
customers, for the three months ended December 31, 2006 as well as the four prior quarters, are set forth in the table below.
For the three months ended
December 31,
2006 September 30,
2006 June 30,
2006 March 31,
2006 December 31,
2005
Opening customers 4,891,500 4,928,700 4,983,800 3,089,800 3,097,300
Data cleanse(1) — — (36,200) — (18,100)
Adjusted opening
customers 4,891,500 4,928,700 4,947,600 3,089,800 3,079,200
Increase in customers
on acquisition of
Telewest — — — 1,880,400 —
Customer additions 213,500 229,200 192,300 167,100 162,800
Customer disconnects (250,500) (266,500) (211,200) (153,500) (142,200)
Net customer
movement (37,000) (37,300) (18,900) 13,600 20,600
Reduction in customer
count(2) — — — — (10,000)
Closing customers 4,854,500 4,891,500 4,928,700 4,983,800 3,089,800
Churn(3) 1.7% 1.8% 1.5% 1.4% 1.6%
Revenue generating
units(4)
Television 3,353,900 3,315,400 3,293,100 3,315,900 1,942,700
DTV (included in
Television) 3,005,900 2,922,000 2,836,200 2,786,500 1,445,100
Telephone 4,114,000 4,178,300 4,233,000 4,268,100 2,573,100
Broadband 3,058,500 2,980,400 2,902,300 2,821,700 1,625,200
Total Revenue
Generating Units 10,526,400 10,474,100 10,428,400 10,405,700 6,141,000
RGU/Customers 2.17x 2.14x 2.12x 2.09x 1.99x
Internet dial−up and
DTV access(5) 73,300 97,000 113,300 140,400 123,700
Cable average revenue
per user(6) £ 42.82 £ 42.48 £ 42.21 £ 40.37 £ 38.96
ARPU calculation:
On−net revenues
(millions) £ 626.7 £ 625.4 £ 628.4 £ 443.3 £ 361.6
Average customers(7) 4,878,800 4,907,400 4,962,300 3,660,500 3,093,500
(1) Data cleanse activity in Q2−06 resulted in a decrease of 36,200 customers and 69,000 RGUs, a decrease of approximately 13,500
Telephone, 24,400 Broadband and 31,100 TV RGUs. Data cleanse
59
Source: VIRGIN MEDIA INVESTM, 10−K, March 01, 2007