Virgin Media 2006 Annual Report Download - page 58
Download and view the complete annual report
Please find page 58 of the 2006 Virgin Media annual report below. You can navigate through the pages in the report by either clicking on the pages listed below, or by using the keyword search tool below to find specific information within the annual report.-
 1
1 -
2
-
3
-
4
-
5
-
6
-
7
-
8
-
9
-
10
-
11
-
12
-
13
-
14
-
15
-
16
-
17
-
18
-
19
-
20
-
21
-
22
-
23
-
24
-
25
-
26
-
27
-
28
-
29
-
30
-
31
-
32
-
33
-
34
-
35
-
36
-
37
-
38
-
39
-
40
-
41
-
42
-
43
-
44
-
45
-
46
-
47
-
 48
48 -
 49
49 -
 50
50 -
 51
51 -
 52
52 -
 53
53 -
 54
54 -
 55
55 -
 56
56 -
 57
57 -
 58
58 -
 59
59 -
 60
60 -
 61
61 -
 62
62 -
 63
63 -
 64
64 -
 65
65 -
 66
66 -
 67
67 -
 68
68 -
69
-
70
-
71
-
72
-
73
-
74
-
75
-
76
-
77
-
78
-
79
-
80
-
81
-
82
-
83
-
84
-
85
-
86
-
87
-
88
-
89
-
90
-
91
-
92
-
93
-
94
-
95
-
96
-
97
-
98
-
99
-
100
-
101
-
102
-
103
-
104
-
105
-
106
-
107
-
108
-
109
-
110
-
111
-
112
-
113
-
114
-
115
-
116
-
117
-
118
-
119
-
120
-
121
-
122
-
123
-
124
-
125
-
126
-
127
-
128
-
129
-
130
-
131
-
132
-
133
-
134
-
135
-
136
-
137
-
138
-
139
-
140
-
141
-
142
-
143
-
144
-
145
-
146
-
147
-
148
-
149
-
150
-
151
-
152
-
153
-
154
-
155
-
156
-
157
-
158
-
159
-
160
-
161
-
162
-
163
-
164
-
165
-
166
-
167
-
168
-
169
-
170
-
171
-
172
-
173
-
174
-
175
-
176
-
177
-
178
-
179
-
180
-
181
-
182
-
183
-
184
-
185
-
186
-
187
-
188
-
189
-
190
-
191
-
192
-
193
-
194
-
195
-
196
-
197
-
198
-
199
-
200
-
201
-
202
-
203
-
204
-
205
-
206
-
207
-
208
-
209
-
210
-
211
-
212
-
213
-
214
-
215
-
216
-
217
-
218
-
219
-
220
-
221
-
222
-
223
-
224
-
225
-
226
-
227
-
228
-
229
-
230
-
231
-
232
-
233
-
234
-
235
-
236
-
237
-
238
-
239
-
240
-
241
-
242
-
243
-
244
-
245
-
246
-
247
-
248
-
249
-
250
-
251
-
252
-
253
-
254
-
255
-
256
-
257
-
258
-
259
-
260
-
261
-
262
-
263
-
264
-
265
-
266
-
267
-
268
-
269
-
270
-
271
-
272
-
273
-
274
-
275
-
276
 |
 |

guidance on the consideration of the effects of prior year misstatements in quantifying current year misstatements for the purpose of a
materiality assessment. SAB 108 establishes an approach that requires quantification of financial statement errors based on the effects
of each of a company’s balance sheet and statement of operations and the related financial statement disclosures. SAB 108 is effective
for fiscal years ending after December 15, 2006. The adoption of SAB 108 did not have a material impact on our consolidated
financial statements.
Consolidated Results of Operations from Continuing Operations
Years ended December 31, 2006 and 2005
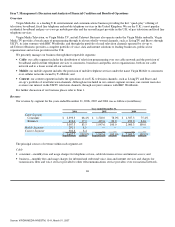
Revenue
For the year ended December 31, 2006, revenue increased by 85.0% to £3,602.2 million from £1,947.6 million for 2005. This
increase is primarily due to the reverse acquisition of Telewest and the inclusion of its revenues from March 3, 2006, and to the acquisition of Virgin Mobile and
the inclusion of its revenues from July 4, 2006.
Cable ARPU has increased steadily through the year, reflecting our drive to encourage “triple−play” bundling and a focus on
better quality customers. Our focus on acquiring new bundled customers and on cross−selling to existing customers is shown by
Revenue Generating Units (RGUs) per customer increasing from 1.99 at December 31, 2005 to 2.17 at December 31, 2006 and by the
percentage of our customers with “triple−play” growing from 29.3% at December 31, 2005 to 40.6% at December 31, 2006. These
increases arise primarily because the number of RGUs per customer and the percentage of customers with “triple−play” were higher in
the legacy Telewest business than in NTL.
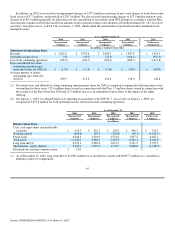
Expenses
Operating costs. For the year ended December 31, 2006, operating costs, including network expenses, increased by 94.6% to
£1,572.8 million from £808.3 million during the same period in 2005. This increase is primarily attributable to the reverse acquisition
of Telewest and to the acquisition of Virgin Mobile. Operating costs as a percentage of revenue increased to 43.7% for the year ended
December 31, 2006, from 41.5% for the same period in 2005, in part due to the inclusion of the Telewest content segment subsequent
to the reverse acquisition of Telewest and the new Mobile segment subsequent to the acquisition of Virgin Mobile, since these
segments have lower margins than our Cable segment.
Selling, general and administrative expenses. For the year ended December 31, 2006, selling, general and administrative
expenses increased by 87.8% to £906.9 million from £483.0 million for the same period in 2005. This increase is primarily attributable
to the reverse acquisition of Telewest and to the acquisition of Virgin Mobile. Selling, general and administrative expenses as a
percentage of revenue increased slightly to 25.2% for the year ended December 31, 2006, from 24.8% for the same period in 2005,
partly due to costs incurred in connection with the integration of NTL and Telewest and increased stock based compensation expense
offset by savings from lower employee related costs as a result of involuntary employee terminations in the year ended December 31,
2006.
In January 2007, we began the extensive marketing campaign behind our new Virgin Media rebrand. We expect this to increase
our normal marketing and advertising costs by over £25.0 million in 2007.
Other charges
Other charges of £67.0 million in the year ended December 31, 2006 relate primarily to employee termination costs and lease exit costs in
connection with our restructuring programs initiated in respect of the reverse acquisition of Telewest.
54
Source: VIRGIN MEDIA INVESTM, 10−K, March 01, 2007