Virgin Media 2006 Annual Report Download - page 46
Download and view the complete annual report
Please find page 46 of the 2006 Virgin Media annual report below. You can navigate through the pages in the report by either clicking on the pages listed below, or by using the keyword search tool below to find specific information within the annual report.-
 1
1 -
2
-
3
-
4
-
5
-
6
-
7
-
8
-
9
-
10
-
11
-
12
-
13
-
14
-
15
-
16
-
17
-
18
-
19
-
20
-
21
-
22
-
23
-
24
-
25
-
26
-
27
-
28
-
29
-
30
-
31
-
32
-
33
-
34
-
35
-
 36
36 -
 37
37 -
 38
38 -
 39
39 -
 40
40 -
 41
41 -
 42
42 -
 43
43 -
 44
44 -
 45
45 -
 46
46 -
 47
47 -
 48
48 -
 49
49 -
 50
50 -
 51
51 -
 52
52 -
 53
53 -
 54
54 -
 55
55 -
 56
56 -
57
-
58
-
59
-
60
-
61
-
62
-
63
-
64
-
65
-
66
-
67
-
68
-
69
-
70
-
71
-
72
-
73
-
74
-
75
-
76
-
77
-
78
-
79
-
80
-
81
-
82
-
83
-
84
-
85
-
86
-
87
-
88
-
89
-
90
-
91
-
92
-
93
-
94
-
95
-
96
-
97
-
98
-
99
-
100
-
101
-
102
-
103
-
104
-
105
-
106
-
107
-
108
-
109
-
110
-
111
-
112
-
113
-
114
-
115
-
116
-
117
-
118
-
119
-
120
-
121
-
122
-
123
-
124
-
125
-
126
-
127
-
128
-
129
-
130
-
131
-
132
-
133
-
134
-
135
-
136
-
137
-
138
-
139
-
140
-
141
-
142
-
143
-
144
-
145
-
146
-
147
-
148
-
149
-
150
-
151
-
152
-
153
-
154
-
155
-
156
-
157
-
158
-
159
-
160
-
161
-
162
-
163
-
164
-
165
-
166
-
167
-
168
-
169
-
170
-
171
-
172
-
173
-
174
-
175
-
176
-
177
-
178
-
179
-
180
-
181
-
182
-
183
-
184
-
185
-
186
-
187
-
188
-
189
-
190
-
191
-
192
-
193
-
194
-
195
-
196
-
197
-
198
-
199
-
200
-
201
-
202
-
203
-
204
-
205
-
206
-
207
-
208
-
209
-
210
-
211
-
212
-
213
-
214
-
215
-
216
-
217
-
218
-
219
-
220
-
221
-
222
-
223
-
224
-
225
-
226
-
227
-
228
-
229
-
230
-
231
-
232
-
233
-
234
-
235
-
236
-
237
-
238
-
239
-
240
-
241
-
242
-
243
-
244
-
245
-
246
-
247
-
248
-
249
-
250
-
251
-
252
-
253
-
254
-
255
-
256
-
257
-
258
-
259
-
260
-
261
-
262
-
263
-
264
-
265
-
266
-
267
-
268
-
269
-
270
-
271
-
272
-
273
-
274
-
275
-
276
 |
 |
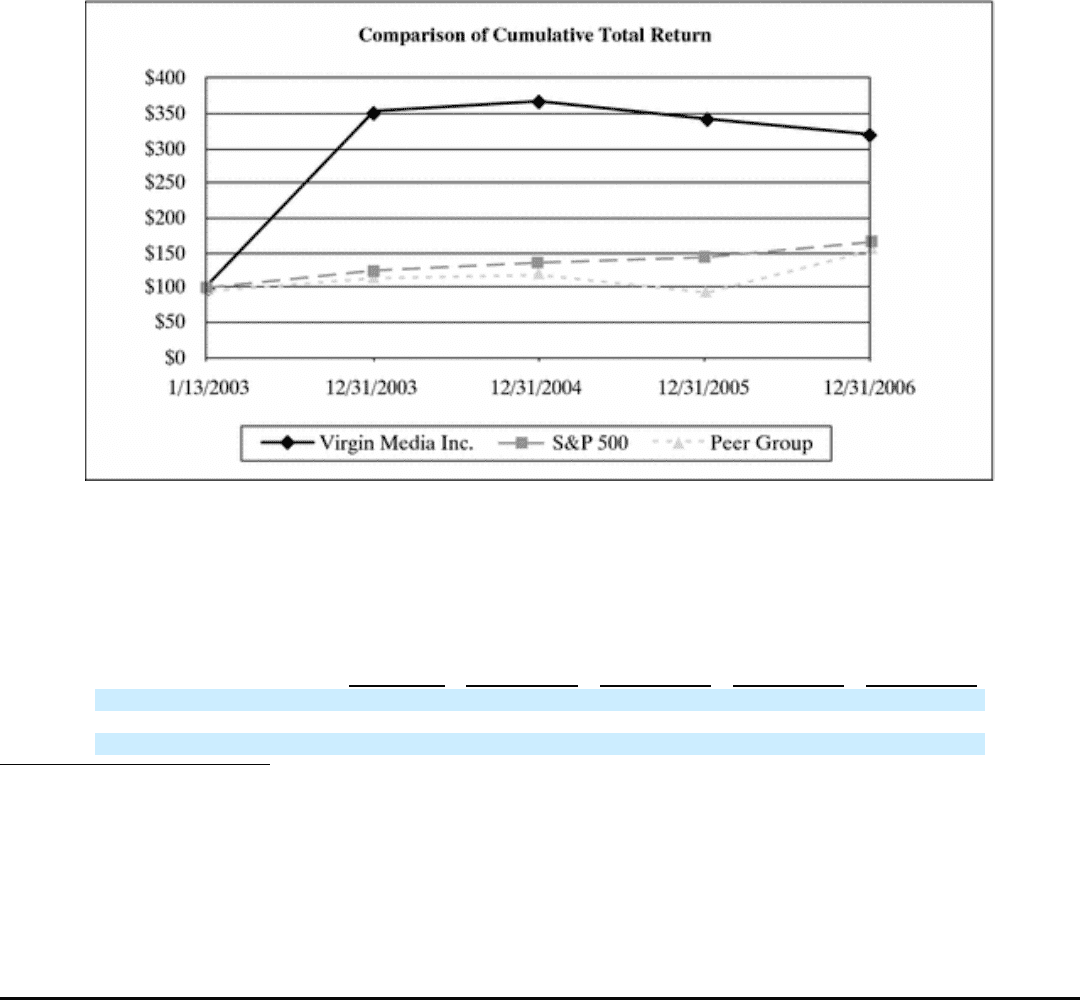
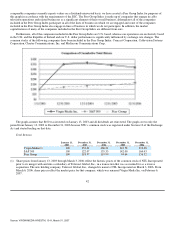
comparable companies currently reports values on a dividends reinvested basis, we have created a Peer Group Index for purposes of
this graph in accordance with the requirements of the SEC. The Peer Group Index is made up of companies that engage in cable
television operations and related businesses as a significant element of their overall business, although not all of the companies
included in the Peer Group Index participate in all of the lines of business in which we are engaged and some of the companies
included in the Peer Group Index also engage in lines of business in which we do not participate. In addition, the market
capitalizations of many of the companies included in the Peer Group Index are different from ours.
Furthermore, all of the companies included in the Peer Group Index are U.S. based, whereas our operations are exclusively based
in the U.K. and the Republic of Ireland and our U.S. dollar performance is significantly influenced by exchange rate changes. The
common stocks of the following companies have been included in the Peer Group Index: Comcast Corporation, Cablevision Systems
Corporation, Charter Communications, Inc. and Mediacom Communications Corp.
The graph assumes that $100 was invested on January 13, 2003 and all dividends are reinvested. The graph covers only the
period from January 13, 2003 to December 31, 2006 because NTL’s common stock was registered under Section 12 of the Exchange
Act and started trading on that date.
Total Returns
January 13,
2003 December 31,
2003 December 31,
2004 December 31,
2005 December 31,
2006
Virgin Media(1) 100 352.01 368.21 343.58 319.08
S&P 500 100 122.07 135.35 142.00 164.43
Peer Group 100 118.97 119.99 94.64 156.52
(1) Share prices from January 13, 2003 through March 3, 2006 reflect the historic prices of the common stock of NTL Incorporated
prior to its merger with and into a subsidiary of Telewest Global, Inc., in a transaction that was accounted for as a reverse
acquisition. The new holding company, Telewest Global, Inc., changed its name to NTL Incorporated on March 3, 2006. From
March 6, 2006, share prices reflect the market price for that company, which was renamed Virgin Media Inc. on February 6,
2007.
42
Source: VIRGIN MEDIA INVESTM, 10−K, March 01, 2007