Virgin Media 2006 Annual Report Download - page 52
Download and view the complete annual report
Please find page 52 of the 2006 Virgin Media annual report below. You can navigate through the pages in the report by either clicking on the pages listed below, or by using the keyword search tool below to find specific information within the annual report.-
 1
1 -
2
-
3
-
4
-
5
-
6
-
7
-
8
-
9
-
10
-
11
-
12
-
13
-
14
-
15
-
16
-
17
-
18
-
19
-
20
-
21
-
22
-
23
-
24
-
25
-
26
-
27
-
28
-
29
-
30
-
31
-
32
-
33
-
34
-
35
-
36
-
37
-
38
-
39
-
40
-
41
-
 42
42 -
 43
43 -
 44
44 -
 45
45 -
 46
46 -
 47
47 -
 48
48 -
 49
49 -
 50
50 -
 51
51 -
 52
52 -
 53
53 -
 54
54 -
 55
55 -
 56
56 -
 57
57 -
 58
58 -
 59
59 -
 60
60 -
 61
61 -
 62
62 -
63
-
64
-
65
-
66
-
67
-
68
-
69
-
70
-
71
-
72
-
73
-
74
-
75
-
76
-
77
-
78
-
79
-
80
-
81
-
82
-
83
-
84
-
85
-
86
-
87
-
88
-
89
-
90
-
91
-
92
-
93
-
94
-
95
-
96
-
97
-
98
-
99
-
100
-
101
-
102
-
103
-
104
-
105
-
106
-
107
-
108
-
109
-
110
-
111
-
112
-
113
-
114
-
115
-
116
-
117
-
118
-
119
-
120
-
121
-
122
-
123
-
124
-
125
-
126
-
127
-
128
-
129
-
130
-
131
-
132
-
133
-
134
-
135
-
136
-
137
-
138
-
139
-
140
-
141
-
142
-
143
-
144
-
145
-
146
-
147
-
148
-
149
-
150
-
151
-
152
-
153
-
154
-
155
-
156
-
157
-
158
-
159
-
160
-
161
-
162
-
163
-
164
-
165
-
166
-
167
-
168
-
169
-
170
-
171
-
172
-
173
-
174
-
175
-
176
-
177
-
178
-
179
-
180
-
181
-
182
-
183
-
184
-
185
-
186
-
187
-
188
-
189
-
190
-
191
-
192
-
193
-
194
-
195
-
196
-
197
-
198
-
199
-
200
-
201
-
202
-
203
-
204
-
205
-
206
-
207
-
208
-
209
-
210
-
211
-
212
-
213
-
214
-
215
-
216
-
217
-
218
-
219
-
220
-
221
-
222
-
223
-
224
-
225
-
226
-
227
-
228
-
229
-
230
-
231
-
232
-
233
-
234
-
235
-
236
-
237
-
238
-
239
-
240
-
241
-
242
-
243
-
244
-
245
-
246
-
247
-
248
-
249
-
250
-
251
-
252
-
253
-
254
-
255
-
256
-
257
-
258
-
259
-
260
-
261
-
262
-
263
-
264
-
265
-
266
-
267
-
268
-
269
-
270
-
271
-
272
-
273
-
274
-
275
-
276
 |
 |

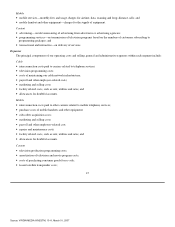
• payroll and other employee−related costs;
• marketing and selling costs;
• repairs and maintenance costs;
• facility related costs, such as rent, utilities and rates; and
• allowances for doubtful accounts.
Acquisitions and Disposals
Acquisition of Virgin Mobile
On July 4, 2006, we acquired 100% of the outstanding shares and options of Virgin Mobile through a U.K. Scheme of
Arrangement for a purchase price totaling £952.2 million, including cash of £418.2 million, common stock valued at £518.8 million
and estimated direct transaction costs of £15.2 million.
Reverse Acquisition of Telewest
On March 3, 2006, NTL merged with a subsidiary of Telewest and the merger has been accounted for as a reverse acquisition of
Telewest using the purchase method. In connection with this transaction, Telewest changed its name to NTL Incorporated, and has
since changed its name to Virgin Media Inc. The total purchase price was £3.5 billion, including cash of £2.3 billion, common stock
valued at £1.1 billion, stock options with a fair value of £29.8 million and estimated direct transaction costs of £25.1 million.
Sale of Broadcast and Ireland Operations
On January 31, 2005, we sold our Broadcast operations, a provider of commercial television and radio transmission services, to a
consortium led by Macquarie Communications Infrastructure Group. The cash proceeds from the sale were £1.3 billion. Our
Broadcast operations provided site leasing, broadcast transmission, satellite, media, public safety communications and other network
services, utilizing broadcast transmission infrastructure, wireless communications and other facilities.
On May 9, 2005, we sold our telecommunications operations in the Republic of Ireland to MS Irish Cable Holdings B.V., an
affiliate of Morgan Stanley for an aggregate purchase price of €333.4 million, or £225.5 million.
As a result of the sale of our Broadcast and Ireland operations, we have accounted for the Broadcast and Ireland operations as
discontinued operations. Financial information for all prior periods presented in this report is restated accordingly. The results of
operations for the Broadcast and Ireland operations have been excluded from the components of loss from continuing operations and
shown in a separate caption, titled income from discontinued operations.
Factors Affecting Our Business
Cable Segment
Our Cable segment residential customers account for the majority of our total revenue. The number of residential customers, the
number and types of services that each customer uses and the prices we charge for these services drive our revenue. Our profit is
driven by the relative margins on the types of services we provide to these customers and by the number of services that we provide to
them. For example, broadband internet is more profitable than our television services and, on average, our “triple−play” customers are
more profitable than “double−play” or “single−play” customers. Our packaging of services and our pricing are designed to encourage
our customers to use multiple services such as television, telephone and broadband at a lower price than each stand−alone product on a
combined basis. Factors particularly affecting our profitability include customer churn, average revenue per user (ARPU),
48
Source: VIRGIN MEDIA INVESTM, 10−K, March 01, 2007