Virgin Media 2006 Annual Report Download - page 118
Download and view the complete annual report
Please find page 118 of the 2006 Virgin Media annual report below. You can navigate through the pages in the report by either clicking on the pages listed below, or by using the keyword search tool below to find specific information within the annual report.-
 1
1 -
2
-
3
-
4
-
5
-
6
-
7
-
8
-
9
-
10
-
11
-
12
-
13
-
14
-
15
-
16
-
17
-
18
-
19
-
20
-
21
-
22
-
23
-
24
-
25
-
26
-
27
-
28
-
29
-
30
-
31
-
32
-
33
-
34
-
35
-
36
-
37
-
38
-
39
-
40
-
41
-
42
-
43
-
44
-
45
-
46
-
47
-
48
-
49
-
50
-
51
-
52
-
53
-
54
-
55
-
56
-
57
-
58
-
59
-
60
-
61
-
62
-
63
-
64
-
65
-
66
-
67
-
68
-
69
-
70
-
71
-
72
-
73
-
74
-
75
-
76
-
77
-
78
-
79
-
80
-
81
-
82
-
83
-
84
-
85
-
86
-
87
-
88
-
89
-
90
-
91
-
92
-
93
-
94
-
95
-
96
-
97
-
98
-
99
-
100
-
101
-
102
-
103
-
104
-
105
-
106
-
107
-
 108
108 -
 109
109 -
 110
110 -
 111
111 -
 112
112 -
 113
113 -
 114
114 -
 115
115 -
 116
116 -
 117
117 -
 118
118 -
 119
119 -
 120
120 -
 121
121 -
 122
122 -
 123
123 -
 124
124 -
 125
125 -
 126
126 -
 127
127 -
 128
128 -
129
-
130
-
131
-
132
-
133
-
134
-
135
-
136
-
137
-
138
-
139
-
140
-
141
-
142
-
143
-
144
-
145
-
146
-
147
-
148
-
149
-
150
-
151
-
152
-
153
-
154
-
155
-
156
-
157
-
158
-
159
-
160
-
161
-
162
-
163
-
164
-
165
-
166
-
167
-
168
-
169
-
170
-
171
-
172
-
173
-
174
-
175
-
176
-
177
-
178
-
179
-
180
-
181
-
182
-
183
-
184
-
185
-
186
-
187
-
188
-
189
-
190
-
191
-
192
-
193
-
194
-
195
-
196
-
197
-
198
-
199
-
200
-
201
-
202
-
203
-
204
-
205
-
206
-
207
-
208
-
209
-
210
-
211
-
212
-
213
-
214
-
215
-
216
-
217
-
218
-
219
-
220
-
221
-
222
-
223
-
224
-
225
-
226
-
227
-
228
-
229
-
230
-
231
-
232
-
233
-
234
-
235
-
236
-
237
-
238
-
239
-
240
-
241
-
242
-
243
-
244
-
245
-
246
-
247
-
248
-
249
-
250
-
251
-
252
-
253
-
254
-
255
-
256
-
257
-
258
-
259
-
260
-
261
-
262
-
263
-
264
-
265
-
266
-
267
-
268
-
269
-
270
-
271
-
272
-
273
-
274
-
275
-
276
 |
 |

VIRGIN MEDIA INC. AND SUBSIDIARIES
NOTES TO CONSOLIDATED FINANCIAL STATEMENTS (Continued)
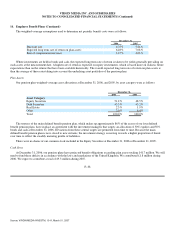
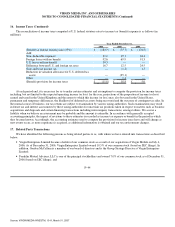
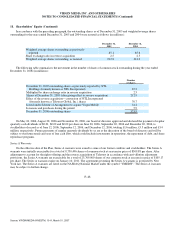
14. Employee Benefit Plans (Continued)
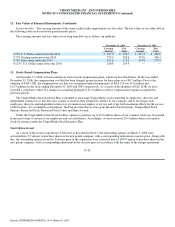
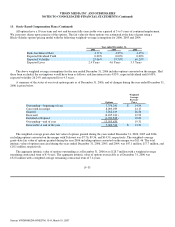
The weighted−average assumptions used to determine net periodic benefit costs were as follows:
December 31,
2006 2005
Discount rate 4.75% 5.24%
Expected long term rate of return on plan assets 6.28% 7.08%
Rate of compensation increase 3.25% 3.03%
Where investments are held in bonds and cash, the expected long term rate of return is taken to be yields generally prevailing on
such assets at the measurement date. A higher rate of return is expected on equity investments, which is based more on realistic future
expectations than on the returns that have been available historically. The overall expected long term rate of return on plan assets is
then the average of these rates taking into account the underlying asset portfolios of the pension plans.
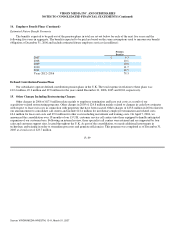
Plan Assets
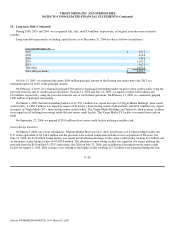
Our pension plan weighted−average asset allocations at December 31, 2006, and 2005, by asset category were as follows:
December 31,
2006 2005
Asset Category
Equity Securities 51.2% 48.5%
Debt Securities 43.5% 43.2%
Real Estate 2.3% 1.9%
Other 3.0% 6.4%
Total 100.0% 100.0%
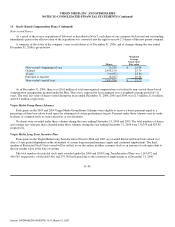
The trustees of the main defined benefit pension plan, which makes up approximately 86% of the assets of our four defined
benefit pension plans, have in place an agreement with the investment managers that targets an allocation of 50% equities and 50%
bonds and cash at December 31, 2006. Deviations from these central targets are permitted from time to time. Because the main
defined benefit pension plan is now closed to new entrants, the investment strategy is moving towards a higher proportion of bonds
over time to reflect the steadily maturing profile of liabilities.
There were no shares of our common stock included in the Equity Securities at December 31, 2006 or December 31, 2005.
Cash flows
At December 31, 2006, our pension plans have projected benefit obligations exceeding plan assets totaling £41.7 million. We will
need to fund these deficits in accordance with the laws and regulations of the United Kingdom. We contributed £1.8 million during
2006. We expect to contribute a total of £9.3 million during 2007.
F−38
Source: VIRGIN MEDIA INVESTM, 10−K, March 01, 2007